
TL;DR
- The order of your returns, not the average, decides whether a 30-year retirement survives. Two retirees can earn the same average and end up worlds apart, a pattern Morningstar documents in detail.
- Big cash and bond cushions invite the one loss that never recovers, inflation. From 1900 to 2000, global bonds returned 1.8% a year after inflation , and cash just 0.8%, compared with 5.1% for stocks.
- A 2024 study found that a 100% equity mix of 33% domestic and 67% international stocks outperformed target-date funds and a 60/40 mix across wealth, income, and bequests.
- The cash-bucket strategy lost to a simple static stock-and-bond mix across 21 countries and 115 years. It manages emotions, not wealth.
- Spending is the variable you control. An amortization-based withdrawal, the Excel PMT method, recalculates your paycheck each year and removes the risk of total depletion.
- Tax timing is a second lever you control. Drawing from traditional accounts in the low-tax window before required minimum distributions begin at age 73, rising to 75 in 2033, can cut lifetime taxes.
- Bill Bengen, who built the 4% rule, now calls inflation the retiree’s “greatest enemy”.
What a retirement withdrawal strategy actually controls
Ask Fidelity, Schwab, or Vanguard how to draw down a portfolio, and you get the same two-part answer: choose a withdrawal rate, then empty accounts in tax-efficient order. Both matter. The variable that decides whether a 30-year retirement survives is whether your spending can flex when the market falls. You cannot control market returns or the order in which they arrive. You can control how much you take out, and when you realize the tax.
Most plans solve the wrong variable. They pile up cash and bonds to defend against a downturn in the market, then keep spending a rigid, inflation-adjusted amount no matter what stocks do. That rigid spending is what turns an ordinary downturn into a permanent loss. Fix the spending rule, and the need for a large cash defense largely disappears, the same conclusion the 2024 all-equity research reached.
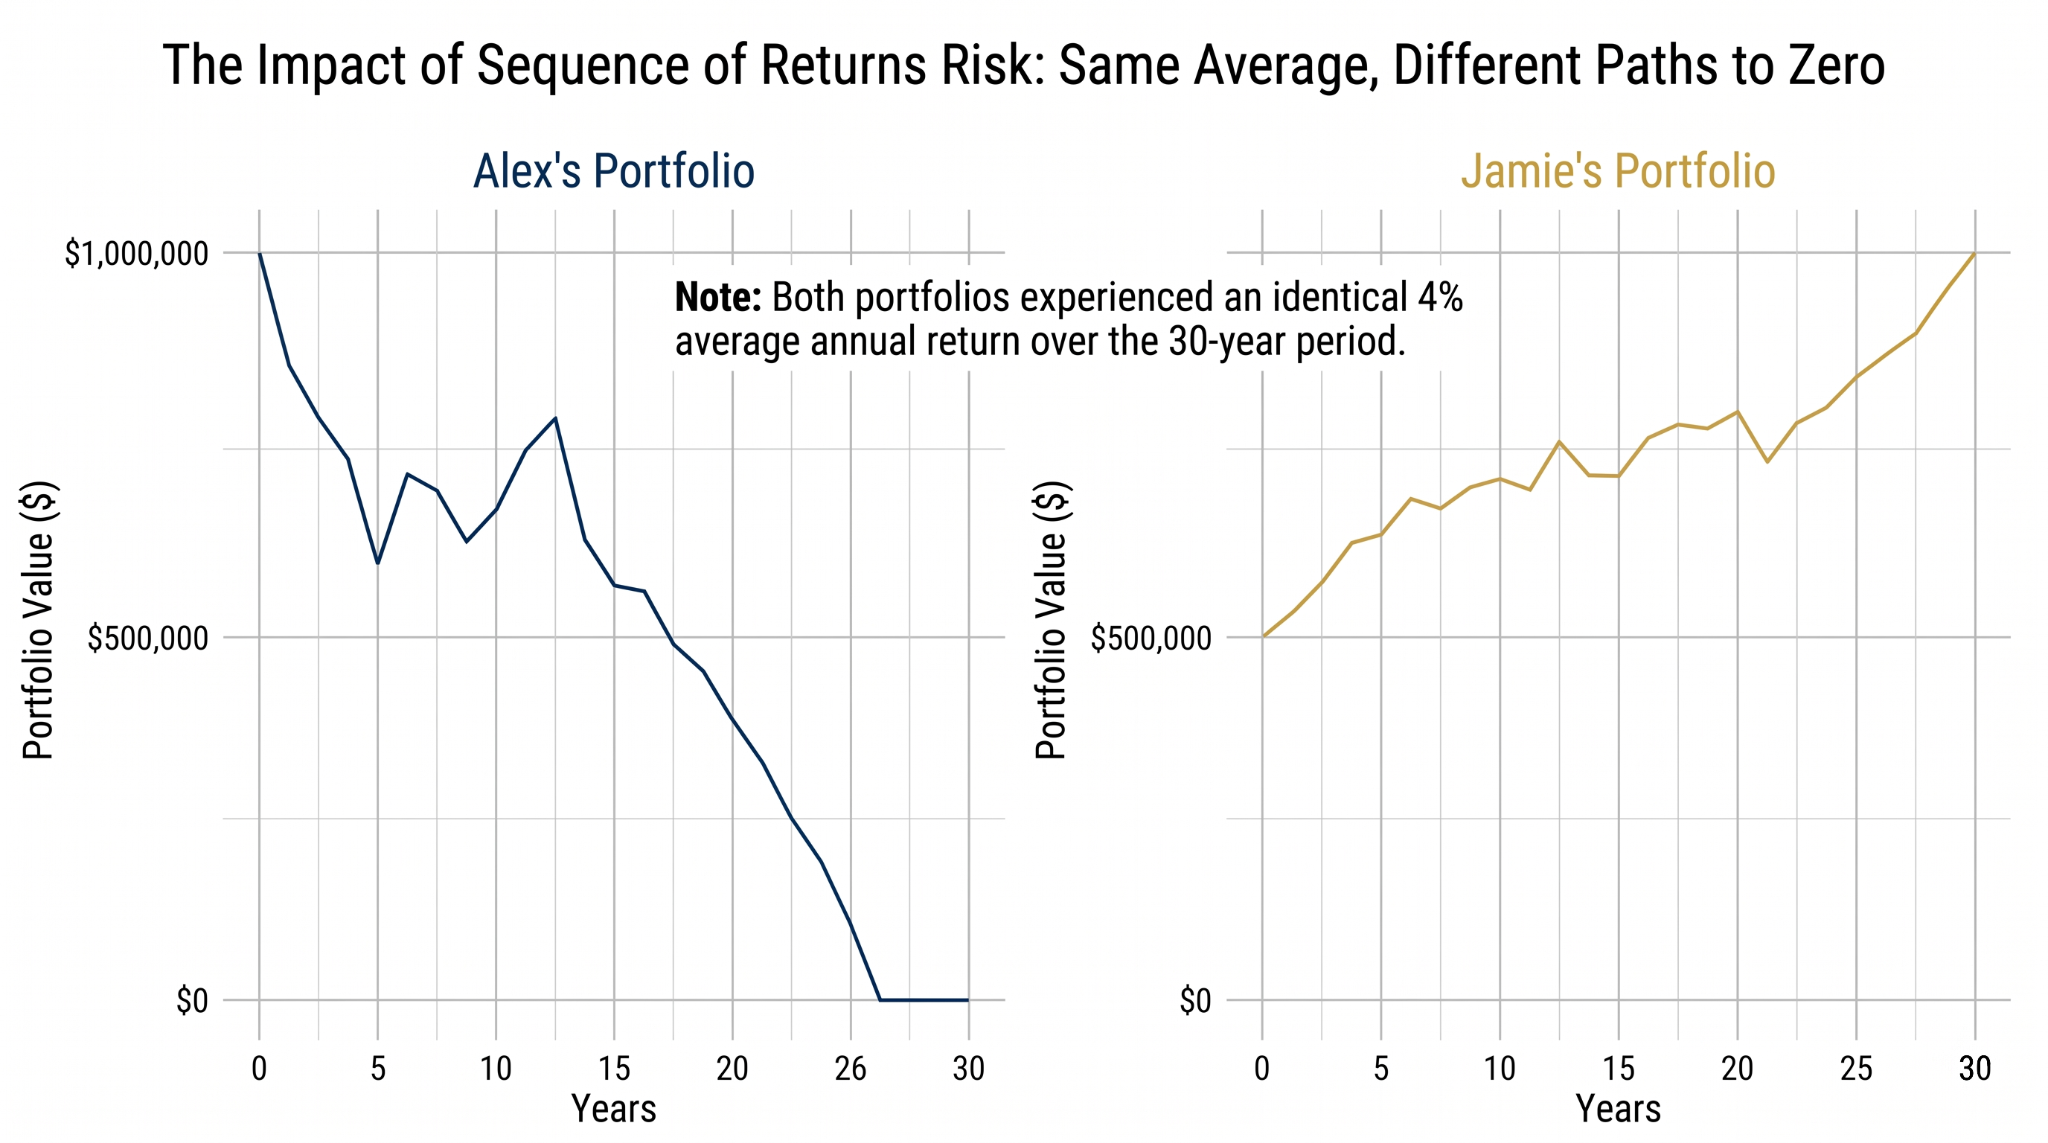
Two retirees, one average, opposite outcomes
Order matters more than the average. Picture Alex and Jamie. Both start a 30-year retirement with the same profile: a $1,000,000 portfolio, a 4% average real return, and $50,000 of inflation-adjusted spending each year.
Alex hits a bad sequence first: −1% returns for five years, then 20% for five. Because losses occur while Alex withdraws $50,000 per year, the portfolio runs dry by year 26. Jamie gets the mirror image, 20% first and −1% later, and finishes year 30 with a large balance. Same average. Same spending. The order alone splits them.
When withdrawals stay constant, the sequence of returns becomes the main driver of success. Early losses paired with rigid withdrawals can break a plan before the long-run average ever shows up.
Why “safe” assets carry the deadliest risk
The standard fix for sequence risk is to hold more cash and bonds. For a retiree facing decades of rising food, housing, and healthcare costs, that move trades a visible risk for a hidden one. Cash and nominal bonds lose purchasing power to inflation, and that loss does not bounce back.
The long record is blunt. Over the 20th century, global stocks returned 5.1% per year after inflation, while bonds returned 1.8% and cash 0.8%. Over 125 years, equities have beaten bonds, bills, and inflation in every country measured. Scott Cederburg’s work shows the catch most plans miss: over long horizons, nominal bonds can carry a larger inflation-driven loss than stocks, because a high-inflation stretch erases their real value with no recovery mechanism.
Stocks fall hard, then tend to recover because expected returns rise after a crash. Cash and nominal bonds have no such spring. Over-weighting them can raise the odds of running out, not lower them, a point Bengen himself now stresses when he names inflation the retiree’s greatest enemy.
Why an all-equity portfolio can fail less often than a glide path
Conventional advice prescribes a glide path: cut stock exposure as you age. A 2024 study, “Beyond the Status Quo” by Anarkulova, Cederburg, and O’Doherty, tested that idea against developed-market data from 1890 to 2019 across 38 countries, simulating roughly a million possible lifetimes.
The optimal portfolio held no bonds. It sat near 33% domestic stocks and 67% international stocks, and it dominated target-date funds and 60/40 mixes on wealth at retirement, income through retirement, savings preserved, and bequests left behind. The authors found target-date investors needed about 63% more savings to match the all-equity result.
The paradox: a 100% equity portfolio has more uncertainty about how large a bequest you leave, yet a lower probability of running out of money than the “conservative” alternatives. The all-equity mix carried roughly half the ruin probability of a target-date fund. The strategy is not for everyone, and serious investors have pushed back on it, but the finding on failure rates is hard to wave away.
Why the cash bucket is comfort, not math
Fidelity, Schwab, and most of the industry love the “cash wedge” or bucket strategy: keep two or three years of spending in cash so you never sell stocks in a dip. It sounds prudent. The data says it is a behavioral trick.
Javier Estrada’s 2019 paper, “The Bucket Approach for Retirement: A Suboptimal Behavioral Trick?”, tested the method across 21 countries over 115 years, from 1900 through 2014. On nearly every metric, the bucket approach lost to a simple static allocation of stocks and bonds that you rebalance. The cash drag costs more than the timing benefit saves.
Here is the part that the research understates and a working advisor sees every week. The bucket’s real product is behavior. A retiree who can point to two years of spending in cash is far less likely to panic-sell at the March 2020 bottom. A strategy you can actually hold through a bear market beats a mathematically superior one you abandon at the worst moment. The honest framing: pay for the comfort if you need it, but know the bill, and keep the cash sleeve small enough that the drag stays minor.

Your withdrawals are the variable you control
Sequence of returns risk is, in practice, sequence of withdrawals risk. The market’s path is fixed and unknowable. The size of your annual withdrawal is a choice.
In the 2024 study, the only reason cash looked useful was that the researchers tested the rigid 4% rule, fixed, inflation-adjusted spending regardless of market conditions. That rule creates the need for a cash cushion. Drop the requirement to spend the same amount in a crash as in a boom, and the mathematical case for holding cash effectively evaporates. The defense was solving a problem that the spending rule created.
How flexible spending works: the amortization method
The 4% rule is a blunt instrument. It ignores the portfolio’s actual value each year. A sharper approach is amortization-based withdrawal, the same math a bank uses to size a loan payment, rooted in work by Paul Samuelson and Robert Merton in 1969. Merton won the Nobel Prize in 1997.
Each year, you recalculate with the Excel or Google Sheets PMT function using three inputs: your portfolio’s current value, an expected return, and the years left in the plan. A retiree with $1,000,000, a 5% assumed return, and a 30-year horizon would draw about $65,000 the first year, then recompute on the new balance every January. When markets fall, the next paycheck steps down a little. The portfolio never amortizes to zero ahead of schedule.
Run it through the worst stretch in the global record, and the gap shows. In my own analysis of returns back to 1900, the harshest 30-year window began in 1913. A rigid 4%-style rule survived that period only at a 3.2% starting rate. The amortization method, adjusting along the way, sustained an average 3.65% in that same disaster. Small, manageable cuts when markets are down keep the plan off the rocks, which is how flexible spending removes the catastrophe inside sequence risk, the same conclusion Kitces reaches on dynamic, small-but-permanent spending adjustments.
Pure year-to-year recalculation can swing the paycheck more than a household wants. The practical middle path is a guardrail rule. The Guyton-Klinger guardrails hold spending steady until the withdrawal rate drifts past a set band, then nudge it down in bad years and up in good ones. Same idea as amortization, smoother ride.
Which accounts to draw first, and the tax lever you control
Every large brokerage answers “retirement withdrawal strategy” with an account order. The standard sequence is taxable accounts first, tax-deferred 401(k)s and traditional IRAs next, Roth last, so the tax-sheltered money compounds the longest. Fidelity, Schwab, and Morningstar all lead with some version of this. It is sound, and it is only half the strategy.
The bigger lever is timing. Traditional 401(k) and IRA withdrawals are taxed as ordinary income; Roth withdrawals are tax-free; and required minimum distributions force money out of traditional accounts starting at age 73, increasing to 75 in 2033. Between the day you retire and the day RMDs and Social Security begin, many retirees sit in an unusually low bracket. Filling that bracket on purpose, by taking traditional withdrawals or converting part of a traditional IRA to Roth even when you do not need the cash, pays tax at today’s rate and shrinks the RMD that would otherwise land at a higher rate later.
Tax timing is the same kind of lever as flexible spending. You control it, the market does not. A retiree who manages the bracket in the low-tax window and flexes spending in a downturn is pulling two controllable levers at once, which is what keeps a withdrawal plan alive when returns turn against it.
Three withdrawal approaches, compared
| Approach | How it sets your withdrawal | Main weakness | Evidence |
| Rigid 4% rule | Fixed first-year percent, raised for inflation every year after | Spends the same in a crash as in a boom, which is what creates sequence risk | Bengen, 1994 |
| Cash bucket | Spend from a 2-3 year cash sleeve to avoid selling stocks in a dip | Cash drag costs more than it saves; the benefit is mostly psychological | Estrada, 2019 |
| Amortization/guardrails | Recompute the paycheck yearly from balance, expected return, and years left | Income varies year to year; it needs a household that can flex its spending | Samuelson-Merton; Guyton-Klinger |
What this means for your plan
The data points to a 100% equity portfolio paired with flexible spending as the statistically strongest setup. That does not make it easy. Behavioral fit matters, and the best plan is the one you can hold through a bear market. If you need a defensive sleeve to sleep at night, TIPS, which adjust their principal for inflation, address the exact risk that sinks nominal bonds, and a small cash buffer can buy real behavioral insurance.
Stop treating “safe” assets as a free lunch. The most effective defense against sequence risk is the willingness to take a little less in the years the market takes from you, and to manage the tax bracket in the years you can. Build the plan around the two levers you control, spending and tax timing, and the market’s order of returns stops being the thing that can end your retirement.
Endnotes
- 1. the order of your returns decides outcomes – Morningstar analysis of sequence-of-returns risk and its two-sided effect on retirement portfolios. https://www.morningstar.com/markets/is-there-an-upside-sequence-return-risk
- 2. global bonds 1.8% and cash 0.8% real, stocks 5.1% – UBS Global Investment Returns Yearbook 2025 (Dimson, Marsh, Staunton), long-run real returns by asset class. https://www.ubs.com/global/en/investment-bank/insights-and-data/2025/global-investment-returns-yearbook-2025.html
- 3. 100% equity 33/67 beat target-date and 60/40 – Anarkulova, Cederburg, and O’Doherty, “Beyond the Status Quo: A Critical Assessment of Lifecycle Investment Advice,” SSRN. https://papers.ssrn.com/sol3/papers.cfm?abstract_id=4590406
- 4. bucket strategy lost across 21 countries, 115 years – Javier Estrada, “The Bucket Approach for Retirement: A Suboptimal Behavioral Trick?” full working paper PDF (IESE). https://blog.iese.edu/jestrada/files/2019/01/BucketApproach.pdf
- 5. amortization-based withdrawal, the Excel PMT method – White Coat Investor explainer on amortization-based withdrawal versus safe withdrawal rates, including Samuelson-Merton origins and the PMT function. https://www.whitecoatinvestor.com/amortization-based-withdrawal-vs-safe-withdrawal-rates/
- 6. required minimum distributions begin at 73, rising to 75 in 2033 – IRS, Retirement Plan and IRA Required Minimum Distribution FAQs (SECURE Act 2.0 start ages). https://www.irs.gov/retirement-plans/retirement-plan-and-ira-required-minimum-distributions-faqs
- 7. Bengen calls inflation the retiree’s greatest enemy – CNBC interview with William Bengen on inflation as the central retirement risk. https://www.cnbc.com/2025/09/03/4percent-rule-inflation-retirement.html
- 8. global stocks 5.1% vs bonds 1.8% vs cash 0.8% (20th century) – London Business School / UBS Global Investment Returns Yearbook 2025, full report PDF. https://assets.london.edu/hxo16fanegqh/21qShhHMZRMqVxYB2gATgV/b78075ce64f874db1e0676a3eccc9856/yearbook.pdf
- 9. equities beat bonds, bills, and inflation in every country over 125 years – UBS media release summarizing 125 years of Global Investment Returns Yearbook data. https://www.ubs.com/global/en/media/display-page-ndp/en-20250304-global-investment-returns-yearbook-2025.html
- 10. nominal bonds can carry a larger inflation-driven loss than stocks – Rational Reminder podcast Ep. 224 with Prof. Scott Cederburg, “Long-Horizon Losses in Stocks, Bonds, and Bills.” https://rationalreminder.ca/podcast/224
- 11. optimal 33% domestic / 67% international, dominated lifecycle funds – Working-paper version of the Anarkulova-Cederburg-O’Doherty all-equity study (UC San Diego / Brandes). https://rady.ucsd.edu/_files/brandes/Challenging%20Lifecycle%20Investing%20The%20Case%20for%20An%20All%20Equity%20Strategy.pdf
- 12. Target-date investors needed about 63% more savings – University of Arizona Eller College summary of the study’s Wall Street Journal coverage. https://eller.arizona.edu/news/scott-cederburg-featured-wall-street-journal-retirement-investing-study
- 13. bucket approach SSRN listing – Javier Estrada, “The Bucket Approach for Retirement: A Suboptimal Behavioral Trick?” SSRN abstract page. https://papers.ssrn.com/sol3/papers.cfm?abstract_id=3274499
- 14. tested across 21 countries, 1900 through 2014 – Estrada, published version, The Journal of Investing, 2019. https://joi.pm-research.com/content/28/5/54
- 15. The case for cash effectively evaporates without rigid spending – Anarkulova, Cederburg, and O’Doherty, SSRN, on cash demand arising from fixed-rule spending assumptions. https://papers.ssrn.com/sol3/papers.cfm?abstract_id=4590406
- 16. dynamic, small-but-permanent spending adjustments – Michael Kitces on dynamic retirement spending with small but permanent variable adjustments. https://www.kitces.com/blog/dynamic-retirement-spending-small-but-permanent-variable-adjustments/
- 17. Guyton-Klinger guardrails – Kitces on flexible spending rules and guardrails as an alternative to a fixed 4% withdrawal. https://www.kitces.com/blog/the-problem-with-fireing-at-4-and-the-need-for-flexible-spending-rules/
- 18. standard tax-efficient withdrawal order – Fidelity, tax-savvy withdrawals: the conventional taxable-then-tax-deferred-then-Roth sequencing. https://www.fidelity.com/viewpoints/retirement/tax-savvy-withdrawals
- 19. partial Roth conversions in the low-tax window – Morningstar, retirement withdrawal sequencing rules of the road, on bracket management and conversions. https://www.morningstar.com/retirement/retirement-withdrawal-sequencing-rules-road
- 20. Bengen, 1994, Origin of the 4% rule – Financial Planning Association, revisiting William Bengen’s SAFEMAX portfolio withdrawal rate. https://www.financialplanningassociation.org/learning/publications/journal/NOV23-revisiting-william-bengens-safemax-portfolio-withdrawal-rate-OPEN
Disclosure
This article is for educational and entertainment purposes only. Nothing here is investment advice, tax advice, legal advice, or accounting advice. I am not your CPA, accountant, attorney, or tax professional, and I am not acting as your financial advisor in this article.
Investing involves risk, including loss of principal. Past performance does not predict future results. Markets, tax law, and individual circumstances change. Before acting on anything you read here, consult a qualified professional who knows your full situation.
Views expressed are my own and do not necessarily reflect the views of VAP Wealth Advisors.
Regulatory Information
ValueAligned Partners LLC is a Registered Investment Advisor. For additional information, please refer to our Form ADV, available on the SEC’s website at www.adviserinfo.sec.gov.
What actually controls a retirement withdrawal strategy?
The size and variability of withdrawals control the plan, not the market returns. You can’t predict returns, but you can decide how much to take out and when to realize taxes. Flexible spending and tax timing are the two levers that keep a withdrawal plan alive when markets turn down.
Why might an all-equity portfolio outperform glide paths or more conservative mixes?
A 100% equity approach, especially with a flexible spending rule, has been shown to carry about half the ruin risk of target-date funds and 60/40 mixes, while potentially leaving larger bequests. The optimal mix found in studies was around 33% domestic and 67% international stocks, with bonds offering less protection over long horizons.
What is the cash bucket strategy, and why is it often not the best math?
The cash bucket keeps two to three years of spending in cash to avoid selling stocks in a dip. But evidence shows cash drag costs more than the timing benefit saves, and the strategy mainly offers behavioral comfort rather than real wealth protection.


