

|
The most profitable investment decision is often the one you don’t make. This guide explains why disciplined inactivity—not apathy, but strategic patience—builds sustainable wealth while most investors self-destruct through unnecessary activity.
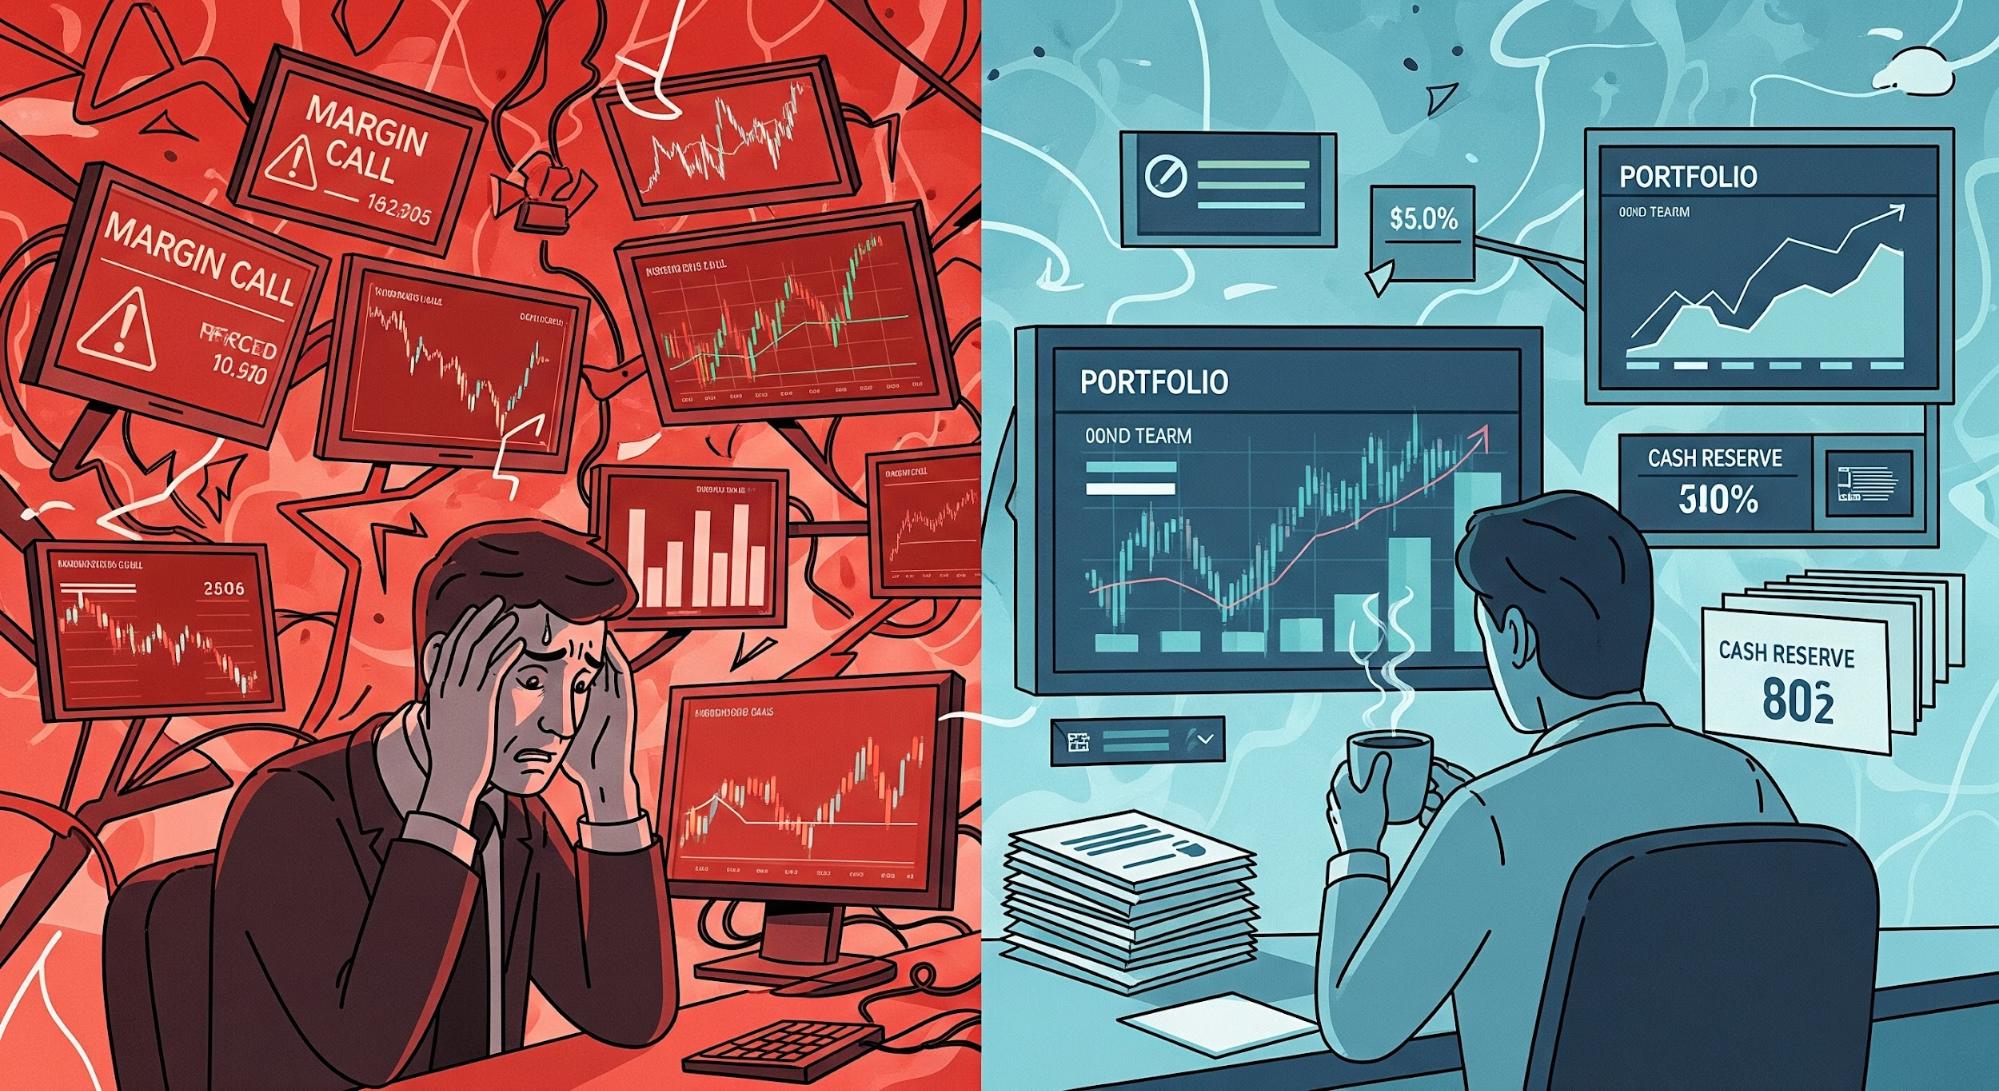
The Three Forces That Destroy Returns Through Forced Activity
Market cycles reliably trigger three psychological and structural pressures that push rational investors into wealth-destroying decisions. Understanding these forces is the first step toward immunity.
Margin Calls: When Mathematics Overrides Strategy
A margin call represents mathematical certainty, not market opinion. When portfolio values decline, lenders require additional collateral or force liquidation to protect their capital. Margin debt reached $773 billion in 2021 before contracting sharply during the 2022 correction, triggering cascading forced sales that amplified market volatility.
The fundamental error isn’t accepting a margin call—it’s structuring leverage that assumes perpetual calm. Research from the Federal Reserve shows that margin-driven selling intensifies drawdowns by 15-30%, converting normal corrections into violent dislocations.
Critical insight: Markets offer the best bargains precisely when margin fear peaks. Investors with unencumbered capital and no forced-seller constraints earn the structural right to buy when it feels most dangerous. This advantage isn’t luck—it’s deliberate balance sheet construction plus behavioral discipline.
Practical margin guardrails:
- Limit margin exposure to conservative levels against volatile equities, or eliminate it entirely
- Calculate your liquidation threshold across multiple decline scenarios before deploying leverage
- Maintain a cash buffer sized to prevent distress selling during normal 20-30% corrections
Tax Anxiety: The Expensive Illusion of Clever Tax Planning
Taxes represent real costs that require intelligent management. However, tax minimization frequently conflicts with wealth maximization. Investors routinely harvest small tax wins while destroying large compounding opportunities through premature selling.
Common manifestations include:
- Selling high-quality winners to “lock in” favorable current-year rates
- Triggering short-term gains to avoid hypothetical future policy changes
- Portfolio rotation driven by tax considerations rather than business fundamentals
Long-term capital gains rates of 0-20% versus short-term rates up to 37% create powerful incentives for extended holding periods. But the real advantage is deferral: each additional year of deferred taxes allows more capital to compound inside the position rather than being extracted prematurely.
Critical insight: Markets compensate patient owners for time in exceptional businesses, not for April tax creativity. The optimal tax strategy often resembles “do nothing” more than it resembles active tax-loss harvesting.
Practical tax guardrails:
- Optimize for after-tax total return over multi-year periods, not single-year tax rates
- Execute partial position trims rather than full exits when rebalancing is required
- Structure withdrawals across multiple years to exploit 0% long-term capital gains brackets, Roth conversion opportunities, and qualified charitable distributions
The Itch to Act: When News Demands Activity
Financial media, algorithmic news feeds, and social validation create continuous pressure to “do something” in response to headlines. The average holding period for U.S. stocks has declined from 8 years in the 1960s to under 6 months today, reflecting the acceleration of noise-driven trading.
This activity is expensive. Dalbar’s annual QAIB study consistently shows that the average equity fund investor underperforms the S&P 500 by 4-5% annually, with the behavior gap—poorly timed entries and exits—explaining most of the shortfall.
Critical insight: The market operates as a wealth transfer mechanism from the impatient to the patient. Every unnecessary trade creates friction (spreads, commissions, taxes, tracking error) while introducing behavioral risk at precisely the moments when emotions are least reliable.
The Compounding Mathematics of Strategic Inactivity
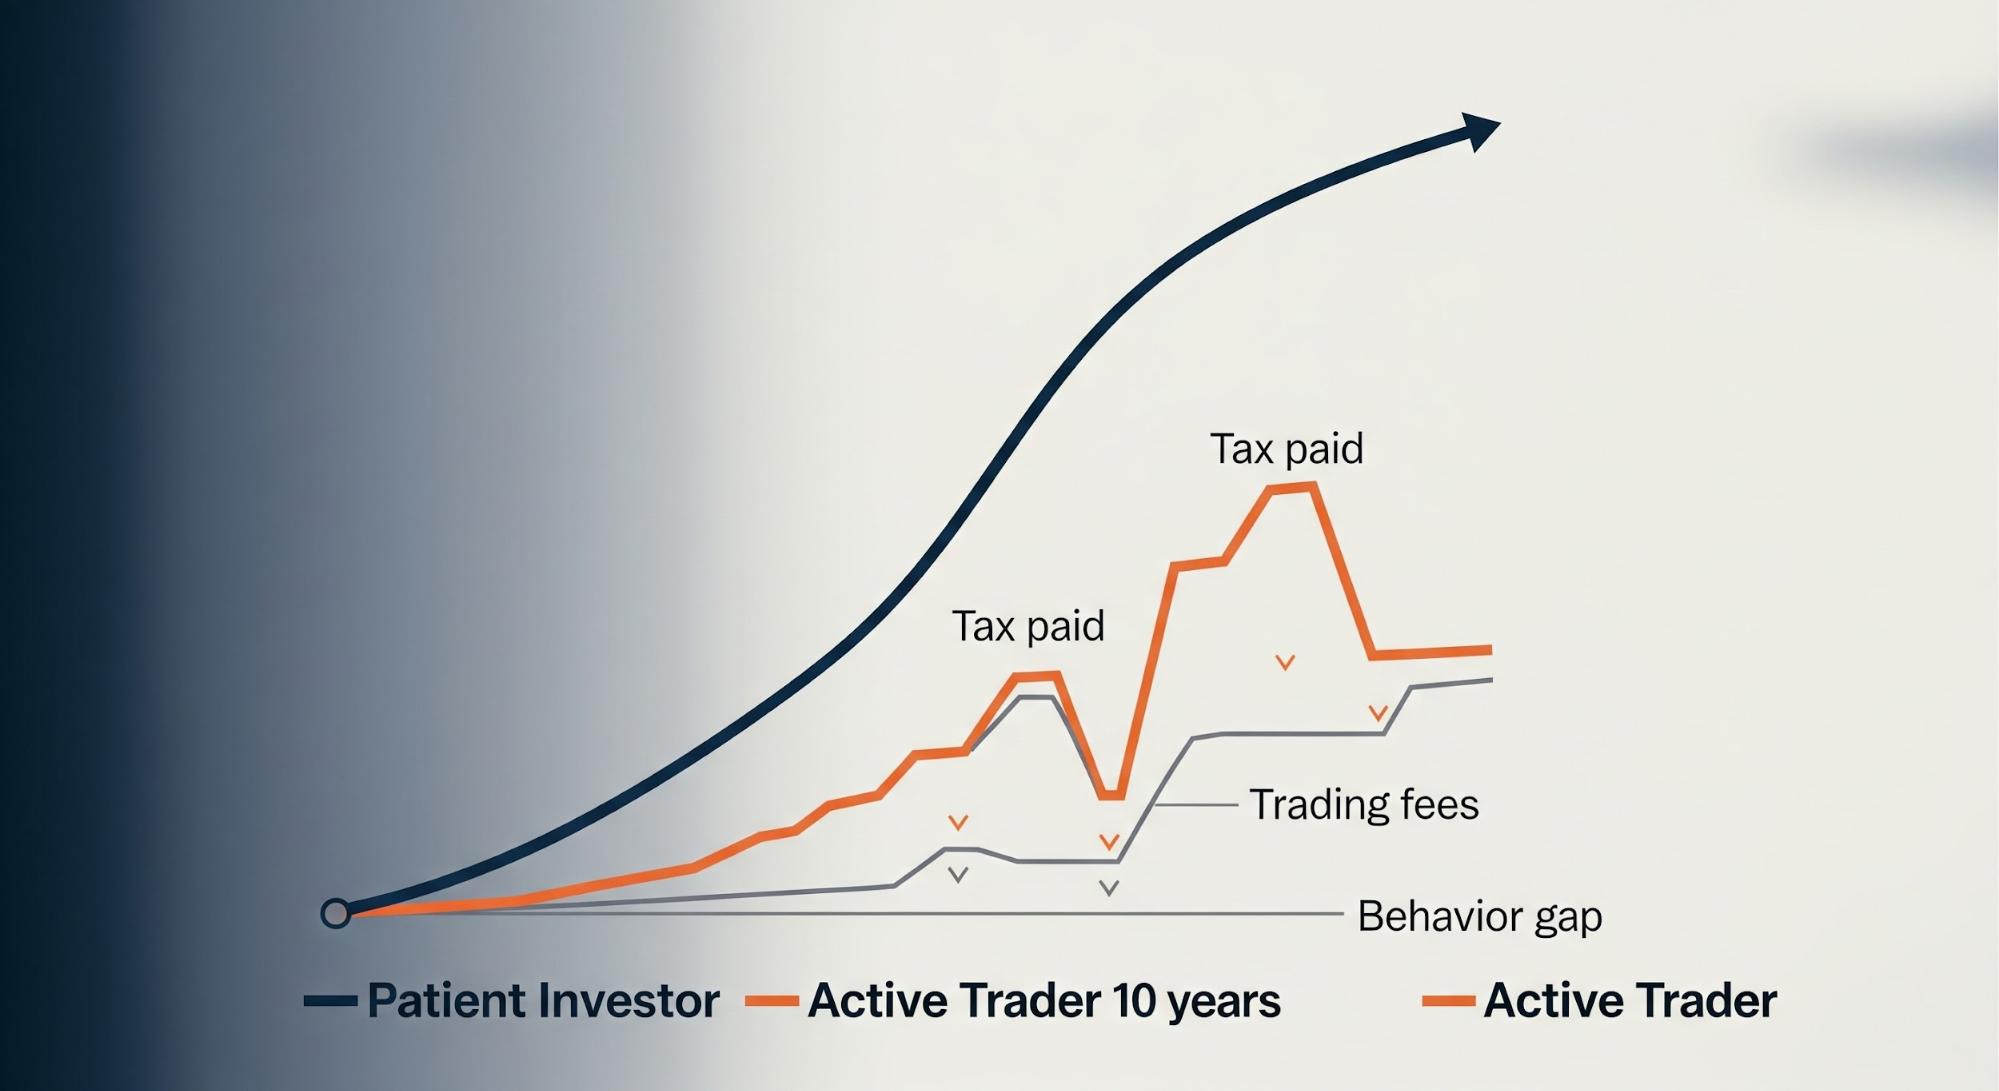
Compounding is multiplicative; trading activity is divisive. Charlie Munger described the ideal holding period as “forever” because indefinite deferral of taxes maximizes the capital available for compounding.
Consider the mathematics: A $100,000 position growing at 12% annually becomes $310,585 after 10 years if held continuously. If, instead, the investor trades annually and pays 20% long-term capital gains tax, the same 12% pre-tax returns yield only $261,832—a permanent 15.7% wealth destruction from activity alone.
Owner mindset decision framework:
Before executing any trade, answer three questions:
- Do I own an exceptional business? Durable competitive advantages, high returns on capital, competent management with aligned incentives
- Did I purchase at a reasonable valuation? Price paid provides a margin of safety against normal business volatility
- Has the investment thesis deteriorated? Business fundamentals have changed, not merely the stock price or media narrative
If the answers remain “yes, yes, and no,” the default action is strategic inactivity.
Inactivity as Pre-Decision, Not Neglect
Strategic inactivity requires more sophistication than constant trading. Professional investors at firms like Fundsmith establish explicit rules during calm periods that override emotional impulses during volatility:
Pre-established decision triggers:
- Rebalancing bands (not feelings) determine when positions require adjustment—typically when positions drift beyond 150% or below 75% of target weight
- Position-size limits constrain concentration risk before euphoria clouds judgment
- Written sell discipline defines only three acceptable reasons to exit: (1) investment thesis has broken, (2) a superior opportunity with much higher expected returns appears, or (3) valuation has reached egregious levels, implying negative forward returns.
Research from Vanguard demonstrates that disciplined rebalancing adds approximately 35 basis points of annual value, but only when executed mechanically rather than emotionally.
Critical insight: We monitor relentlessly but act sparingly. Continuous business analysis ensures we understand competitive dynamics, but this knowledge informs decisions to do nothing as often as decisions to trade.
Three Scenarios Where Doing Nothing is Doing Everything
Scenario A: Market Drawdowns and Apocalyptic Headlines
Average intra-year declines for the S&P 500 approximate 14% annually, even in years that finish positive. Research from JPMorgan shows that missing just the 10 best market days over 20 years reduces annualized returns from 9.5% to 5.6%—the cost of emotional exits during drawdowns.
Default response: Hold existing positions or add selectively to the highest-conviction ideas.
Rationale: Declining prices combined with stable business fundamentals mathematically increase forward expected returns. Temporary quotational losses create permanent wealth gains for disciplined buyers.
Scenario B: Large Embedded Gains and Potential Tax Liability
A position purchased at $50 now trades at $200, creating substantial unrealized gains. The temptation to “take profits” or “rebalance” feels prudent, but the mathematics of compounding plus deferral frequently favor continued holding.
Default response: Defer realization if the business continues generating returns on capital above 15-20%.
Rationale: A business compounding at 15% annually delivers superior after-tax returns compared to realizing gains, paying 20% capital gains taxes, and redeploying into a 10-12% alternative. The deferral advantage alone justifies holding for another decade.
Scenario C: Exciting “New Thing” Attracting Universal Enthusiasm
Novel investment themes—cryptocurrencies, SPACs, meme stocks, AI hype cycles—generate powerful FOMO pressure. Data from Renaissance Technologies shows that 90% of SPACs that completed mergers in 2020-2021 traded below their initial offering price within two years.
Default response: Pass unless the opportunity clears established quality and valuation hurdles.
Rationale: Opportunity cost is real, but chronic trading incurs certain costs (friction, taxes, behavioral errors) to pursue uncertain gains. Most “hot” investments mean-revert violently.
The Snowball Mental Model for Wealth Accumulation
Warren Buffett’s snowball metaphor captures the essence of compound wealth creation:
- Great business = sticky, wet snow that accumulates mass as it rolls
- Time = the long hill that allows continuous accumulation
- Strategic inactivity = resisting the urge to pick the snowball apart constantly
Every unnecessary trade represents a warm hand disrupting accumulation. Buffett’s success stems not from superior stock-picking but from allowing exceptional businesses to compound for 60+ years without interruption.
Critical insight: The snowball model works only when compounding operates uninterrupted across decades. The investor’s primary job is to remove obstacles to compounding, not to identify the next “hot” opportunity.
How ValueAligned Partners Implements Disciplined Inactivity
Our investment process exists to maximize compounding surface area while minimizing mistake surface area:
- Rigorous upfront analysis: Deep business quality evaluation, competitive advantage assessment, and valuation discipline create high-conviction positions
- Portfolio construction rules: Position sizing, sector limits, and geographic diversification constraints establish risk guardrails
- Tax-aware rebalancing: Multi-year tax mapping identifies optimal timing for Roth conversions, 0% long-term capital gains harvesting, and qualified charitable distributions
- Behavioral scaffolding: Pre-established decision rules override emotional impulses during market extremes
This framework performs the difficult analytical work upfront, enabling the brave behavioral work later: predominantly sitting still.
Your Action Plan: The Paradox of Planning to Do Nothing
Schedule a comprehensive portfolio review focused on three defensive assessments:
1. Margin exposure audit: Calculate your liquidation threshold under 20%, 30%, and 40% market decline scenarios. If any scenario triggers forced selling, reduce leverage immediately.
2. Multi-year tax strategy: Map the next 3-5 years of income, deductions, and potential capital gains realizations. Identify opportunities for Roth conversions during low-income years, 0% capital gains harvesting, and charitable gifting of appreciated securities.
3. Rebalancing band definition: Establish explicit position-size ranges that trigger mechanical rebalancing. Define the three conditions that justify selling: thesis deterioration, vastly superior opportunity, or egregious overvaluation.
The outcome of this review might be operational changes. More often, it confirms that your optimal move—the courageous move—is strategic inactivity.
Conclusion: Courage, Not Apathy
The discipline to do nothing when emotions demand activity represents one of investing’s scarcest skills. Research across multiple studies confirms that investor behavior explains more return variation than security selection, asset allocation, or market timing.
Strategic inactivity isn’t laziness or neglect—it’s the ultimate expression of long-term orientation. It requires:
- Conviction in business quality assessment
- Confidence in valuation discipline
- Courage to ignore noise and narratives
- Patience to allow compounding to operate across decades
Markets transfer wealth from the impatient to the patient, from the active to the strategically inactive, from those who must do something to those with the courage to do nothing.
Stay patient. Own exceptional businesses at reasonable prices. Let time and compounding work.
Endnotes
- Morningstar Mind the Gap – Annual study measuring the behavior gap between fund returns and investor returns
https://www.morningstar.com/lp/mind-the-gap - Schwab Capital Gains Tax – Comprehensive guide to capital gains taxation and deferral strategies
https://www.schwab.com/learn/story/capital-gains-tax-101
- Collaborative Fund Psychology of Money – Analysis of Warren Buffett’s wealth accumulation pattern and the power of compounding over decades
https://www.collaborativefund.com/blog/the-psychology-of-money/
- FINRA Margin Statistics – Historical margin debt levels and their correlation with market volatility
https://www.finra.org/investors/learn-to-invest/advanced-investing/margin-statistics
- Federal Reserve Margin Study – Research on margin-driven selling and market amplification effects
https://www.federalreserve.gov/econres/feds/files/2020027pap.pdf
- IRS Capital Gains Facts – Official guidance on capital gains taxation, holding periods, and rate structures
https://www.irs.gov/newsroom/capital-gains-and-losses-10-helpful-facts-to-know
- IRS Capital Gains Tax Topics – Detailed explanation of long-term versus short-term capital gains treatment
https://www.irs.gov/taxtopics/tc409
- Financial Times Stock Holding Periods – Analysis of declining average holding periods for U.S. equities
https://www.ft.com/content/fa4dff8e-5bfb-11e7-9bc8-8055f264aa8b
- Berkshire Hathaway Annual Letter – Charlie Munger’s commentary on the ideal holding period and tax deferral
https://www.berkshirehathaway.com/letters/2021ltr.pdf
- Fundsmith: When to Sell – A Professional investor framework for establishing sell discipline
https://www.fundsmith.co.uk/news-views/articles/when-to-sell
- Vanguard Advisor Value – Quantitative research on the value of disciplined rebalancing and advisor guidance
https://advisors.vanguard.com/insights/article/putadvisorvalueperspective
- BlackRock Market Volatility – Historical analysis of intra-year market declines versus full-year returns
https://www.blackrock.com/us/individual/insights/overview-market-volatility
- JPMorgan Guide to the Markets – Research on the cost of missing best market days during volatile periods
https://am.jpmorgan.com/us/en/asset-management/adv/insights/market-insights/guide-to-the-markets/
- Institutional Investor SPAC Analysis – Performance tracking of SPAC mergers and mean reversion patterns
https://www.institutionalinvestor.com/article/b1q3fyd4b42ck4/The-Spectacular-Rise-and-Fall-of-SPACs