
- The real retirement risk is outliving your money, not temporary market drops. Longevity plus inflation quietly erode purchasing power over multi-decade retirements—OECD data shows people at age 65 can expect to live approximately 18.5 more years (men) and 21.6 more years (women) on average (OECD Pensions at a Glance 2025).
- Equities have historically outpaced inflation by a wide margin. Over 125 years (1900–2024), worldwide equities delivered approximately 5.2% annualized real returns versus 1.7% for bonds and 0.5% for bills (UBS Global Investment Returns Yearbook 2025).
- Market “pain” is usually temporary. The average market correction (a 10–20% decline) typically takes about 5 months to bottom and about 4 months to recover (Invesco).
- Behavior beats brilliance. In 2024, the Average Equity Investor earned just 16.54% compared to the S&P 500’s 25.05% return—an 8.5 percentage point gap primarily driven by poor timing decisions (DALBAR QAIB 2025).
- Do these four things relentlessly: Set dollar-and-date goals, write a plan, automate contributions through dollar-cost averaging, and withdraw with rules in retirement. These behaviors drive the bulk of long-run outcomes.
David L. Berkowitz, Chief Investment Officer and Financial Advisor
Started in the early 1990s as a trader and research associate at a $250 million hedge fund, later managing portfolios for 20 years while teaching thousands of employees and executives EVA and value-based management. Today, he helps individuals and families apply those same principles — owning great businesses directly and investing with discipline for life.
This guide distills a research-backed framework to reduce retirement anxiety and build what we call “inevitable wealth”—wealth made likely through repeatable behavior rather than prediction.
What Risk Actually Matters in Retirement?
The biggest long-term risk is running out of purchasing power before you run out of life, not the market’s short-term fluctuations.
Remaining life expectancy at age 65 is substantial. According to OECD data, men can expect to live approximately 18.5 additional years after reaching 65, while women can expect approximately 21.6 more years (OECD Pensions at a Glance 2025). This underscores multi-decade income needs that must outpace inflation.
Equities help preserve purchasing power. The UBS Global Investment Returns Yearbook 2025, based on 125 years of data across 35 markets, found that worldwide equities delivered approximately 5.2% annualized real returns compared to just 1.7% for bonds and 0.5% for bills (Cambridge Judge Business School). U.S. equities have delivered approximately 9.7% annualized nominal returns since 1900 (UBS).
Volatility is the toll on the road to inflation-beating returns, not the threat. Safety isn’t the absence of price swings—it’s the presence of lasting purchasing power.
Where Does Retirement Anxiety Come From?
The 401(k) revolution turned millions into “accidental investors,” forced to choose funds and timing without a manual—fueling overwhelm, distrust, and fear.
The shift from defined-benefit to defined-contribution plans has been dramatic. In 1975, private-sector defined-benefit plans had 27.2 million active participants, while defined-contribution plans had 11.2 million. By 2019, those numbers had essentially reversed: defined-benefit plans had just 12.6 million active participants while defined-contribution plans had 85.5 million (Congressional Research Service).
The 401(k) emerged after the Revenue Act of 1978 and IRS guidance in 1981, initially intended as a supplemental savings vehicle rather than a primary retirement tool. Congress did not originally intend for 401(k)s to replace traditional pensions as a primary retirement vehicle (Economic Policy Institute).
Anxiety is structural, not personal. You were asked to drive a complex machine without a map. Replace decision overload with a written, rule-based plan.
What Causes the Biggest Money Mistakes?
Panic (selling low) and FOMO (buying high) are the twin behavioral traps that destroy returns.
DALBAR’s 2025 Quantitative Analysis of Investor Behavior report reveals that the Average Equity Investor earned just 16.54% in 2024, compared to the S&P 500’s 25.05% return—an 8.5 percentage-point gap, the second-largest investor performance gap of the past decade (DALBAR). Withdrawals from equity funds occurred in every quarter of 2024, with the largest outflows taking place just before a significant return surge.
Research consistently shows investment results are more dependent on investor behavior than on fund performance. Fund investors who remained patient and avoided reacting to short-term market fluctuations achieved significantly better outcomes (Index Fund Advisors).
You don’t need superior forecasts—you need emotional guardrails. As the saying goes: “The stock exchange is the only place where they hold a sale and everyone runs screaming.”

How Long Do Market Recoveries Really Take?
Even severe equity setbacks have been temporary on a total-return basis.
The average time to recovery from a 5–10% market downturn is about three months. For 10–20% corrections, the average recovery time is approximately eight months (Invesco). On average, corrections take approximately 5 months to bottom out, but once the market turns positive, it typically recovers in about 4 months (IG Canada).
State Street Global Advisors’ research examining data from 1928 through March 2025 shows that after 10% pullbacks from highs, forward returns have skewed positive on average. The index has delivered positive returns in subsequent periods, and periods with positive returns have seen the 10% pullback fully reversed on average within just three months (State Street Global Advisors).
Bear markets (declines of 20% or more) typically last longer but still recover. Since 1966, the average bear market has lasted roughly 14 months—far shorter than the average bull market. Since World War II, there have been 12 bear markets with an average decline of 32.5%, yet markets have recovered from every one (Charles Schwab).
In a 30-year retirement, a multi-year drawdown is a storm, not a shipwreck—if you stay invested—plan for volatility so you can ignore it when it arrives.
What Should Long-Term Investors Own to Keep Up With Inflation?
Own a diversified slice of productive assets (equities). “Be an owner, not a loaner.”
Long-Run Real Returns (1900–2024)
| Asset Class | Annualized Real Return | Typical Volatility |
| Global Equities | ~5.2% | ~17–20% |
| U.S. Equities | ~6.5–6.6% | ~19.8% |
| Bonds | ~1.6–1.7% | ~10.7% |
| 60/40 Portfolio | ~5.1% | ~13.4% |
| Cash/Bills | ~0.5% | ~3% |
Source: UBS Global Investment Returns Yearbook 2025, DMS Database (UBS)
Over decades, equities are the engine; bonds smooth the ride. A diversified portfolio of 60% equities and 40% bonds achieved an annualized real return of 5.1% with volatility of 13.4% over the long term. Your allocation should be chosen for purchasing-power goals, not for this quarter’s headlines.
What Behaviors Produce “Inevitable Wealth”?
Four repeatable moves account for most lifetime outcomes:
1. Set Goals — Make them dollar-specific and date-specific. “We need $X per year from our portfolio by Month/Year for Y years.”
2. Make a Plan — One page is better than none. Document your target mix, funding schedule, rebalancing cadence, and “do-nothing” rules.
3. Invest Automatically — Use dollar-cost averaging via payroll or auto-transfers.
4. Withdraw Smart — Adopt a systematic withdrawal method in retirement.
Regarding dollar-cost averaging, Vanguard research finds that lump-sum investing outperforms dollar-cost averaging approximately 68% of the time over one-year horizons because markets generally trend upward. However, dollar-cost averaging reduces regret risk and helps investors stick with their plan during volatile markets—which is critical for long-term success (Vanguard).
For most investors, automating regular contributions removes the temptation to time the market—Automate decisions in advance so your future self cannot overrule the plan in a panic. Consistency beats cleverness.
How Should You Structure Withdrawals to Avoid Panic in Retirement?
Use rules-based withdrawals—and consider guardrails that adjust spending after significant market moves.
Withdrawal Strategy Options
| Strategy | How It Works | Best For |
| Fixed % (3.7–4%) | Withdraw a fixed percentage of the initial portfolio, adjust for inflation | Those prioritizing income stability |
| Guardrails (Guyton-Klinger) | Start higher (~5%), cut/raise by rules based on portfolio performance | Behaviorally resilient DIYers |
| Buckets | Maintain a 1–3 years cash plus balanced growth portfolio | Visual thinkers seeking security |
| TIPS Ladder | Build a ladder of Treasury Inflation-Protected Securities | Maximum certainty seekers |
Morningstar’s 2024 research established 3.7% as the baseline safe starting withdrawal percentage for a 30-year time horizon with a 90% probability of success—down from 4.0% in 2023 due to higher equity valuations and lower bond yields (Morningstar). However, guardrail methods that adjust withdrawals based on portfolio performance can support higher starting rates of approximately 5% or more when the retiree accepts cuts during downturns.
Older retirees with shorter time horizons can reasonably spend more. A retiree with a 20-year horizon can safely spend more than 5% of a balanced portfolio, while someone with a 15-year horizon could reasonably spend nearly 7% (Morningstar).
The Value of Professional Guidance
Vanguard’s Advisors’ Alpha framework estimates that advice—especially behavioral coaching—can add approximately 3% to net returns over time, with behavioral coaching alone worth up to 150 basis points (1.5%) annually (Vanguard). As one framework puts it: “An advisor’s fee is the annual premium on an insurance policy against lonely panic.”
Pick a rules-based withdrawal approach before markets get scary. Spending rules are stress inoculation for your plan.
Exactly How Long Must I Be Willing to Stay the Course?
Plan for multiple years, not months.
The longest modern-era total-return drawdowns have lasted approximately 5–6 years (starting 1968). The 2008 financial crisis took approximately 4 years to recover, while the 2000 dot-com crash also took about 5 years to return to previous highs (Capital Group). The COVID-19 pandemic crash of March 2020, while dramatic (34% decline), recovered in just six months—the fastest recovery of any market crash in 150 years (Morningstar).
If you cannot give equities 5–10 years, keep enough cash and bonds to fund near-term needs. Time horizon is a risk filter—stretch it, and most “risks” fade into noise.
- Behavior gap (2024): Average equity investor +16.54% vs. S&P 500 +25.05% = 8.5 percentage point lag
- Equity real return (Global, 1900–2024): ~5.2% annualized
- 60/40 Portfolio real return (Long-term): ~5.1% annualized with ~13.4% volatility
- Average correction recovery: ~4 months after bottoming
- Life expectancy at 65 (OECD, 2024): ~18.5 years (men), ~21.6 years (women)
- Advisor value (Vanguard): Up to ~3% net return added, with behavioral coaching worth ~1.5%
Conclusion
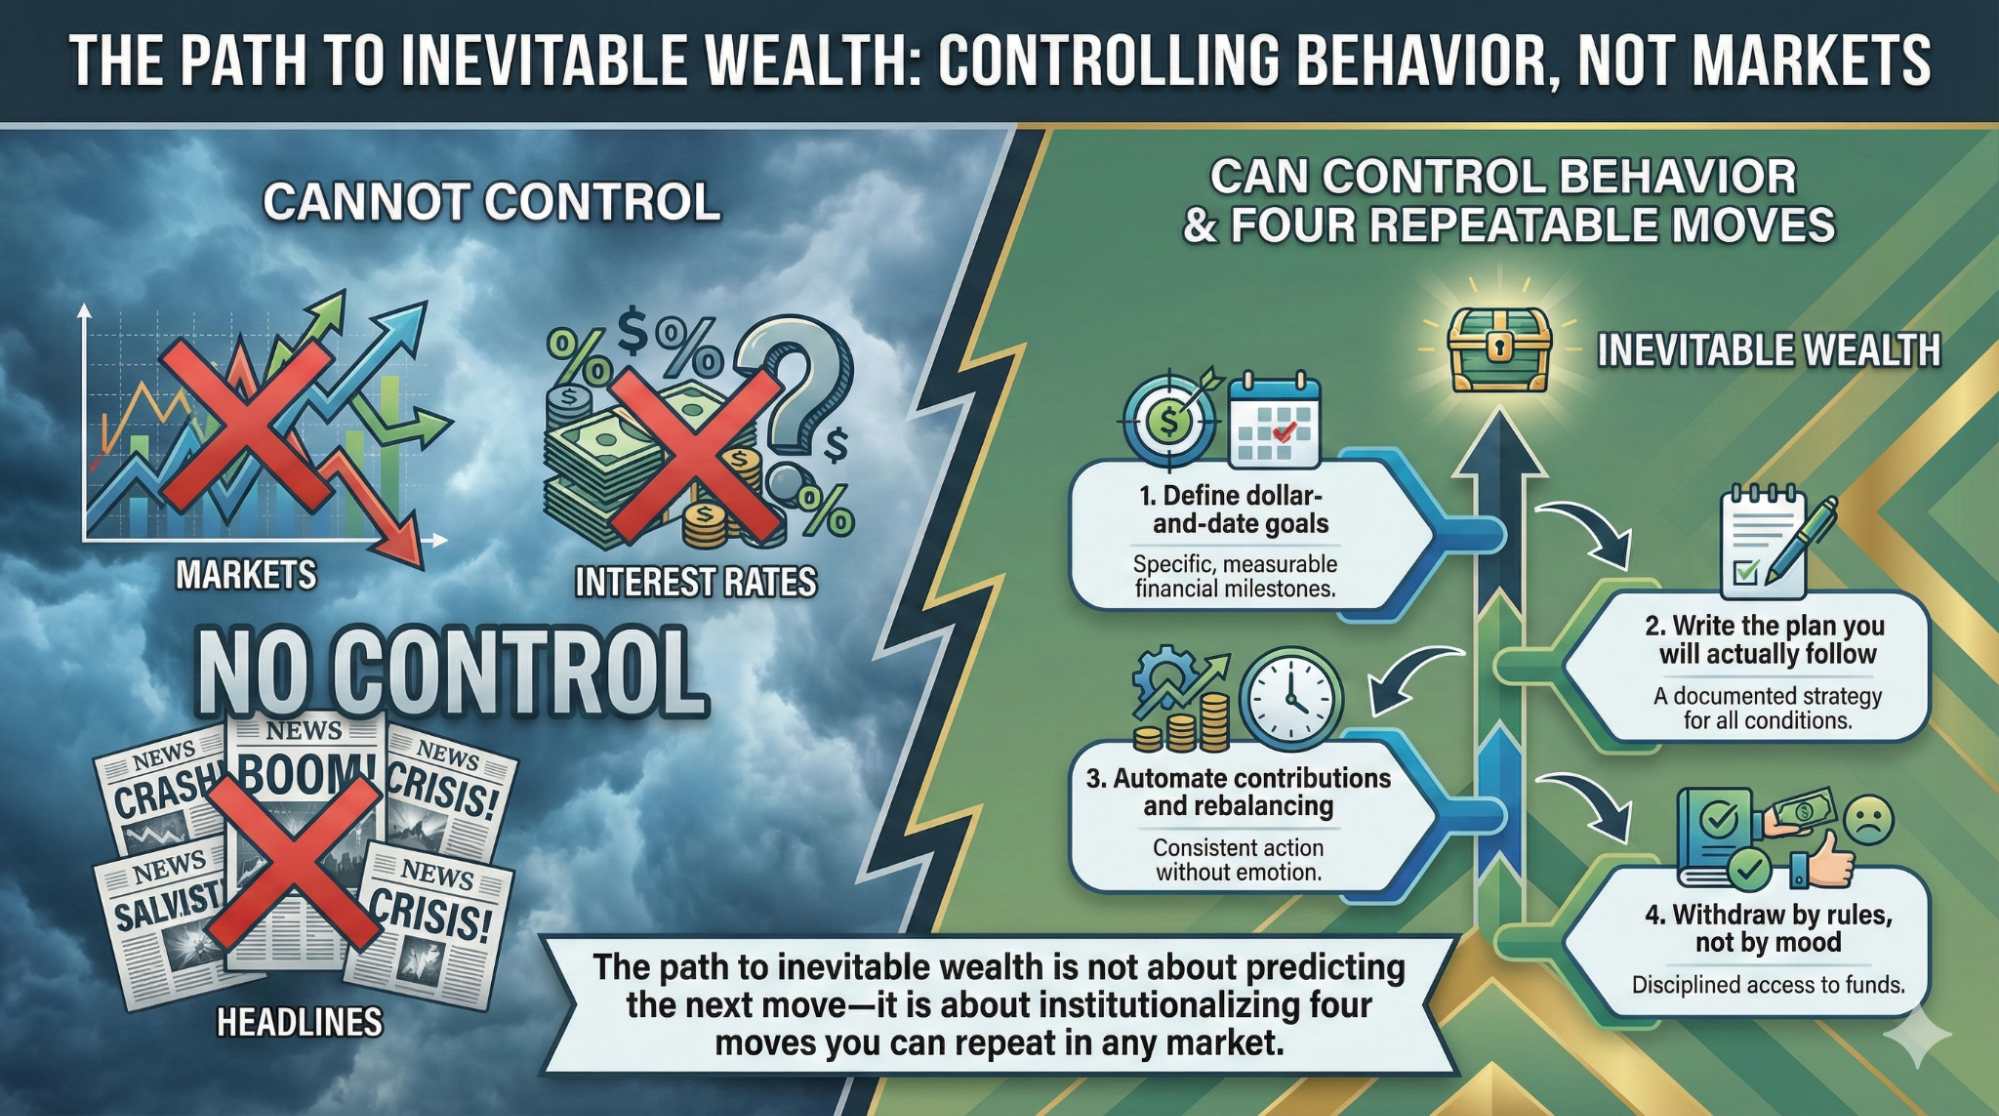
You cannot control markets, interest rates, or headlines. You can control behavior. The path to inevitable wealth is not about predicting the next move—it is about institutionalizing four moves you can repeat in any market:
- Define dollar-and-date goals
- Write the plan you will actually follow
- Automate contributions and rebalancing
- Withdraw by rules, not by mood
If you remember only one line, make it this: Wealth isn’t driven by investment performance, but by investor behavior.
Endnotes
- DALBAR QAIB 2025 – Official press release reporting the Average Equity Investor earned 16.54% in 2024 versus 25.05% for the S&P 500
https://www.prnewswire.com/news-releases/investors-missed-the-best-of-2024s-market-gains-latest-dalbar-investor-behavior-report-finds-302416023.html - UBS Global Investment Returns Yearbook 2025 – Cambridge Judge Business School summary of 125-year analysis showing worldwide equities delivered 5.2% annualized real returns
https://www.jbs.cam.ac.uk/2025/report-stocks-have-far-outperformed-over-the-past-125-years/ - UBS Global Investment Returns Yearbook 2025 – Ten key insights including U.S. equity returns of 9.7% annualized and 60/40 portfolio characteristics
https://www.ubs.com/global/en/wealthmanagement/insights/marketnews/article.1983595.html - OECD Pensions at a Glance 2025 – Life expectancy data at age 65 showing 18.5 years for men and 21.6 years for women
https://www.oecd.org/en/publications/pensions-at-a-glance-2025_e40274c1-en/full-report/future-retirement-ages_23752280.html - Congressional Research Service – Visual depiction of the shift from defined benefit to defined contribution plans showing participant counts
https://www.congress.gov/crs-product/IF12007 - Economic Policy Institute – Analysis of 401(k) origins and the decline of defined benefit coverage
https://www.epi.org/publication/retirement-in-america/ - Invesco – Stock market corrections research showing average recovery times of 3 months for 5-10% declines and 8 months for 10-20% corrections
https://www.invesco.com/us/en/insights/investors-stock-market-corrections.html - IG Canada – Analysis of stock market correction and recovery timelines
https://www.ig.ca/en/insights/how-long-does-it-take-stock-markets-to-recover-from-a-downturn - State Street Global Advisors – Weekly market update showing positive forward returns after 10% pullbacks using data from 1928-2025
https://www.ssga.com/uk/en_gb/institutional/insights/weekly-market-update-04-april-2025 - Charles Schwab – Market correction definitions and historical bear market analysis
https://www.schwab.com/learn/story/market-correction-what-does-it-mean - Vanguard – Research on lump-sum investing versus dollar-cost averaging showing LSI outperforms 68% of the time
https://investor.vanguard.com/investor-resources-education/news/lump-sum-investing-versus-cost-averaging-which-is-better - Morningstar – State of Retirement Income 2024 research establishing 3.7% as baseline safe withdrawal rate
https://www.morningstar.com/retirement/whats-safe-retirement-spending-rate-2025 - Morningstar – How retirees can determine safe withdrawal rates for different time horizons
https://www.morningstar.com/retirement/how-retirees-can-determine-safe-withdrawal-rate-2025 - Vanguard Advisor’s Alpha – Framework quantifying advisor value at approximately 3% in net returns with behavioral coaching worth up to 150 basis points
https://advisors.vanguard.com/advisors-alpha - Capital Group – Historical analysis of market declines and recovery timelines
https://www.capitalgroup.com/individual/planning/market-fluctuations/past-market-declines.html - Morningstar – 150 years of stock market crash analysis showing COVID-19 had fastest recovery in history
https://www.morningstar.com/economy/what-weve-learned-150-years-stock-market-crashes - Index Fund Advisors – Analysis of DALBAR QAIB 2025 findings on investor behavior
https://www.ifa.com/articles/understanding-investor-behavior-portfolio-performance
Compliance Note: This article is for informational purposes and is not individualized financial, tax, or legal advice. Investing involves risk, including loss of principal. Past performance does not guarantee future results.


