Executive Summary
The U.S. stock market concluded the week ending July 26, 2025, with notable strength, as both the S&P 500 and Nasdaq Composite achieved new all-time closing highs. The S&P 500 notably recorded its first “perfect week” of all-time highs since November 2021, signaling broad investor optimism. All three major indices—the S&P 500, Nasdaq, and Dow Jones Industrial Average—posted weekly gains exceeding 1%.
This robust performance was primarily driven by increasing optimism surrounding a potential trade agreement between the United States and the European Union (EU), a generally positive corporate earnings season, and a perceived easing of broader geopolitical tensions.
Sectoral performance exhibited divergence, with Healthcare and Industrials emerging as the top performers, while Consumer Defensives and Technology lagged. Individual stock movements varied, showcasing significant gains for companies such as Deckers Outdoor and Newmont, alongside declines for Intel and Charter Communications, which were influenced by specific corporate developments. A discernible resurgence in “meme stock” trading further underscored a heightened appetite for risk within particular market segments.
The economic backdrop presented a nuanced picture. The Leading Economic Index (LEI) registered a decline, suggesting potential future headwinds, while the Coincident Economic Index (CEI) showed a modest rise, indicating current economic stability. Employment figures remained steady, though inflation saw an uptick. Domestically, U.S. political developments, particularly the enactment of the GENIUS Act related to stablecoins and the ongoing tariff negotiations with the EU, remained central to market sentiment.
Looking forward, market participants are closely monitoring the upcoming Federal Reserve meeting, where interest rates are widely expected to remain unchanged, although expectations for a September rate cut are growing. The continuation of the second-quarter earnings season, featuring reports from major technology companies, and the impending August 1st tariff deadline are anticipated to be critical determinants of market direction in the immediate future.
I. Overall Market Performance: Week Ending July 26, 2025
Performance of Major Indices
The U.S. equity markets demonstrated significant strength during the week ending July 26, 2025, with key indices reaching new milestones. On July 25, the S&P 500 concluded the trading day at a record high of 6,388.64, marking a 0.4% increase. The Nasdaq Composite also closed at an all-time high, gaining 0.24% to reach 21,108.32. The Dow Jones Industrial Average similarly advanced, climbing 0.47% to 44,901.92.
For the entirety of the week, the S&P 500 recorded a gain of 1.5%, the Nasdaq added 1%, and the Dow Jones Industrial Average rose by 1.3%.1 A notable achievement for the S&P 500 was closing at a record high every day of the week, marking its first “perfect week” of all-time highs since November 2021. The tech-heavy Nasdaq Composite also demonstrated sustained momentum, closing at a new high in nine of the past ten sessions.
Trading Volume and Market Sentiment
Despite the impressive rally to record highs, trading volume remained relatively light throughout the week. Approximately 17.7 billion shares were traded, which is below the 20-day average of 18.1 billion shares. This reduced volume occurred ahead of the Federal Reserve’s policy meeting scheduled for the following week.
The market’s ascent to record levels on lighter volume suggests that while headline performance was strong, the underlying conviction or broad participation might not be as robust as typically seen in strong rallies. This could indicate a cautious optimism among investors, where buying activity is present but not aggressively widespread. The impending Federal Reserve meeting and the August 1st tariff deadline likely contributed to this cautious stance, as some investors may have chosen to reduce their activity while awaiting clarity on these significant events.
Despite the looming August 1st tariff deadline and the associated threats of increased import duties, financial markets maintained a “sanguine” posture regarding the tariff situation. Leading U.S. indexes continued to show modest gains even on Friday, the last trading day of the week. This market composure, in the face of potential trade friction, indicates that investors may have either already factored in the tariff risks or have become desensitized to such threats, perceiving them more as negotiating tactics rather than immediate economic catastrophes. The positive market reaction suggests that the prospect of avoiding much higher tariffs and retaliatory measures is viewed as a favorable outcome, even if a baseline tariff rate is ultimately imposed. This ability of the market to absorb and discount political rhetoric, focusing instead on the potential for “less bad” outcomes, highlights a degree of resilience or perhaps a learned adaptation to the current political landscape.
Table 1: Major US Index Performance (Week Ending July 26, 2025)
| Index Name | Weekly Change (%) | Closing Value (July 25) | Key Milestones |
|---|---|---|---|
| S&P 500 | +1.5% | 6,388.64 | Fifth straight record close; First “perfect week” of all-time highs since Nov 2021 1 |
| Nasdaq Composite | +1.0% | 21,108.32 | Record high; New high in nine of past 10 sessions 1 |
| Dow Jones Industrial Average | +1.3% | 44,901.92 | Close to its first record high since December 1 |
The data in Table 1 provides a quantitative summary of the week’s overall market health, directly addressing the user’s request for market performance. It highlights significant achievements like the S&P 500’s “perfect week,” which are important psychological and historical markers for market participants. This foundational information serves as a crucial starting point for understanding the broader context before delving into the specific drivers, sectors, and individual stock performances.
II. Key Market Drivers
A. Economic Landscape: US Indicators and Outlook
The U.S. economic picture for June 2025, as reflected in various indicators, presented a complex and somewhat divergent narrative.
Leading and Coincident Economic Indexes
The Conference Board Leading Economic Index (LEI) for the U.S. declined by 0.3% in June 2025, reaching 98.8 (2016 = 100). This followed a revised flat reading in May. Over the first half of 2025, the LEI fell by 2.8%, a substantially faster rate of decline compared to the 1.3% contraction observed in the second half of 2024. This forward-looking index suggests potential headwinds for the economy in the near term. The stock price rally was the primary factor preventing a steeper decline in the LEI for the second consecutive month. However, this market strength was insufficient to offset persistent low consumer expectations, weak new orders in manufacturing, and a third straight month of rising initial claims for unemployment insurance.
In contrast, the Conference Board Coincident Economic Index® (CEI) for the U.S., which reflects the current state of the economy, rose by 0.3% in June 2025 to 115.1 (2016=100), after remaining unchanged in April and May. The CEI’s growth of 0.8% over the first half of this year, while slower than the 1.0% growth in the preceding six months, indicates ongoing economic activity. All four components of the CEI—payroll employment, personal income less transfer payments, manufacturing and trade sales, and industrial production—showed improvement in June.
This divergence between the declining LEI and the modestly rising CEI is a significant observation. While the current economic situation, as indicated by the CEI, appears stable with improvements across its components, the LEI’s persistent decline suggests that underlying pressures are building. The stock market’s rally, while a positive component of the LEI, could not fully offset the drag from factors such as rising initial unemployment claims and weak manufacturing orders, which are potentially linked to the uncertainty surrounding tariffs. The Conference Board’s projection of a substantial slowdown in real GDP growth to 1.6% for 2025, explicitly citing the impact of tariffs and slowing consumer spending, reinforces the concern that the real economy might be decelerating even as financial markets remain buoyant. This dynamic implies that investors should exercise caution, as the current market strength might not entirely reflect the challenges indicated by leading economic indicators.
June 2025 Inflation (CPI) Data
Inflation data for June 2025 showed an uptick in consumer prices. The Consumer Price Index for All Urban Consumers (CPI-U) increased by 0.3% on a seasonally adjusted basis in June, following a 0.1% rise in May. Over the last 12 months, the all-items index increased by 2.7%, up from 2.4% in May. The core CPI, which excludes volatile food and energy components, rose by 2.9% over the same 12-month period. The energy index saw a 0.9% increase in June, with gasoline prices rising by 1.0%, while the food index increased by 0.3%.
This combination of rising inflation and projections for slowing economic growth due to the impact of tariffs creates a challenging environment for monetary policy. If tariffs lead to higher import prices, this could exacerbate inflationary pressures while simultaneously dampening consumer spending and overall economic activity. This scenario presents a tricky balancing act for policymakers.
June 2025 US Employment Data
The U.S. labor market remained stable in June 2025. Total nonfarm payroll employment increased by 147,000 jobs, and the unemployment rate held steady at 4.1%. The unemployment rate has consistently remained within a narrow range of 4.0% to 4.2% since May 2024. Job gains were primarily observed in state government, which added 47,000 positions, and in health care, which saw an increase of 39,000 jobs. Conversely, the federal government continued to experience job losses, declining by 7,000 positions. Average hourly earnings for all employees on private nonfarm payrolls rose by 0.2% to $36.30 in June, marking a 3.7% increase over the preceding 12 months. The Conference Board Employment Trends Index™ (ETI) remained level in June, consistent with the solid employment report. While initial claims for unemployment insurance increased modestly, continuing claims rose steadily without accelerating, suggesting that while some job market fluidity exists, widespread layoffs are not yet a significant concern.
June 2025 US Retail Sales
Advance estimates for U.S. retail and food services sales in June 2025 indicated continued consumer activity. Total sales reached $720.1 billion, representing a 0.6% increase from the previous month and a 3.9% rise from June 2024. For the second quarter (April-June 2025), total sales were up 4.1% compared to the same period last year. Nonstore retailers experienced a 4.5% year-over-year increase, while food service and drinking places saw a robust 6.6% rise. These figures suggest sustained consumer spending, which is a vital component of U.S. economic activity, despite concerns about potential tariff impacts.
Federal Reserve’s Stance on Interest Rates and Market Expectations
The Federal Reserve is widely anticipated to maintain its current interest rate levels at its upcoming policy meeting on July 31. Despite this expectation, traders are pricing in a 60% chance of a rate cut by September, according to CME’s FedWatch tool. This sentiment is echoed by President Trump, who has reiterated his call for lower rates and expressed confidence that Fed Chair Jerome Powell may soon act. Analysts from Morningstar Wealth Management also project two federal-funds rate cuts this year.
The market’s strong expectation for rate cuts, particularly by September, serves as a significant tailwind for equity valuations. However, the underlying economic data, specifically the rising inflation figures and the slowing Leading Economic Index, present a complex challenge for the Federal Reserve. If inflation persists or accelerates, potentially exacerbated by tariffs, the Fed might be compelled to delay rate cuts, which could lead to market disappointment. Conversely, a more pronounced economic slowdown than currently anticipated could intensify pressure on the Fed to ease monetary policy. This creates a delicate balance for the Fed, where its decisions will be heavily scrutinized and could trigger significant market volatility if they deviate from current expectations.
B. Geopolitical Dynamics and Global Trade
Geopolitical developments and global trade dynamics significantly influenced market sentiment during the week.
Progress and Uncertainty Surrounding US-EU Trade Deal Negotiations
Optimism surrounding a potential trade agreement between the U.S. and the European Union (EU) served as a significant catalyst for market buoyancy. On July 25, President Trump indicated that the chances of striking a deal were “50-50, maybe less than that,” ahead of a planned meeting with European Commission President Ursula von der Leyen in Scotland. The White House’s August 1st deadline for finalizing trade agreements with the EU and other nations looms large, with Trump threatening a 30% tariff on EU imports if no deal is reached.
European officials, while signaling preparedness to impose levies on over $100 billion worth of U.S. goods starting August 7 if an agreement is not reached, also indicated openness to a 15% U.S. baseline tariff rate. Trade experts suggest that a potential U.S.-EU agreement could mirror the recent U.S.-Japan pact, which involved a 15% tariff on Japanese imports in exchange for Japan’s commitment to invest $550 billion in the U.S. and further open its market to U.S. exports. Reports this week suggested the EU and U.S. were “on the brink of agreeing a trade deal with a 15% baseline tariff,” which, despite not being an ideal outcome, would prevent much higher U.S. tariffs and subsequent retaliation, contributing to positive market reactions.
This market reaction, driven by “trade deal hopes,” reflects a response to the threat of higher tariffs rather than a fundamental shift away from protectionist policies. The Trump administration’s stated objective to “dramatically expand tariffs and reshore critical supply chains” suggests that trade friction is an enduring feature of the global economic landscape, not merely a temporary issue. Investors are likely reacting positively to the prospect of avoiding a worst-case scenario, indicating a market that has either priced in or become accustomed to the ongoing trade uncertainty.
Broader Global Trade Trends and Geoeconomic Risks
Global trade expanded by an estimated $300 billion in the first half of 2025, with growth rates of 1.5% in Q1 and a projected 2% in Q2. Price increases significantly influenced this rise in trade value, while trade volumes grew by a more modest 1%. Developed economies, particularly the U.S. (experiencing a 14% surge in imports) and the EU (with a 6% jump in exports), outpaced developing countries in Q1 2025, reversing recent trends that had favored the Global South. Concurrently, trade imbalances widened, with the U.S. recording a larger deficit, while China and the EU posted growing surpluses.
Looking ahead, global trade is expected to face mounting headwinds in the second half of 2025, primarily due to persistent policy uncertainty, ongoing geopolitical tensions, and indications of slowing global growth.16 A significant trend observed is the increasing concentration in digital markets, where the top five digital multinational enterprises now account for 48% of global sales, a substantial increase from 21% in 2017. Seven of the world’s ten most valuable companies are now digital giants, spanning sectors such as cloud services, e-commerce, artificial intelligence (AI), and online advertising.
The rapid expansion of generative AI is adding to these concerns, with major technology companies like Microsoft and Google dominating the value chain and consolidating their leading positions through partnerships with start-ups like OpenAI. Governments worldwide are responding to this concentration, with the number of global competition interventions rising from 14 in 2020 to 153 since then. This environment suggests that ongoing trade uncertainty, driven by U.S. priorities, is becoming the “new normal,” with a high likelihood of dramatic tariff increases negatively impacting the macro outlook. AI is also at the heart of U.S.-China strategic competition and technology decoupling, as the Trump administration continues to control China’s access to advanced hardware. Seventeen populist policy influences are expected to motivate protectionism further and limit immigration in 2025, with the U.S. leading efforts to expand tariffs and reshore critical supply chains.
Impact of Ongoing International Conflicts and Political Events
The Russia-Ukraine conflict remains the most significant military conflict in Europe since World War II, with direct talks failing to yield an agreement since early 2025. Risks also persist from sustained instability in East and West Africa, and the growing threat from the Islamic State. In the Middle East, the situation in Gaza was described as “terror and chaos,” with UN aid teams reporting “mayhem” and starvation, and mass displacement orders issued by the Israeli military. Aid also reached Sweida, Syria, for the first time amidst deadly violence. In Asia, polls opened in Taiwan’s key “recall election” on July 26, an event closely monitored by China. Discussions at the EU-China summit also focused on trade and other critical issues. The 25th Anniversary of the UN Global Compact was observed on July 26.
The dual nature of AI, serving as both an immense economic opportunity and a source of significant geopolitical tension, is particularly noteworthy. The economic benefits and rapid adoption of AI are driving massive capital expenditures, as evidenced by Alphabet’s increased CapEx forecast to $85 billion. This economic imperative for AI leadership directly fuels geopolitical competition, as nations vie for technological supremacy and control over critical hardware and infrastructure. This implies that investment in the technology sector, particularly AI, will continue to be a dominant theme, but it will increasingly be intertwined with geopolitical risk. Companies heavily reliant on global supply chains or operating in sensitive technology areas may face increased regulatory scrutiny, export controls, or market access challenges due to these rivalries.
C. United States Political Developments
U.S. political developments had a significant impact on market dynamics during the week, particularly regarding new legislation and the president’s influence on economic policy.
Impact of Recently Signed Legislation
The Guiding and Establishing National Innovation for U.S. Stablecoins Act (GENIUS Act) was signed into law by President Trump on July 18, 2025, marking the first primary crypto legislation in the United States. This act establishes licensing and regulatory requirements for domestic payment stablecoin issuers, sets standards for foreign issuers, and mandates custody and safekeeping requirements for related assets. It defines explicitly payment stablecoins, requiring them to be 1:1 backed by liquid assets such as U.S. currency or Treasury bills, and mandates regular audits and transparent disclosures. Crucially, the GENIUS Act classifies stablecoin issuers as financial institutions under the Bank Secrecy Act, thereby subjecting them to robust anti-money laundering (AML) and counter-terrorism financing (CTF) compliance. The act explicitly clarifies that payment stablecoins are not classified as securities, deposits, or commodities, providing much-needed legal certainty.
Complementing this, the Digital Asset Market Clarity Act of 2025 (CLARITY Act) passed the U.S. House of Representatives on July 17, 2025, with strong bipartisan support (294-134 votes), and has now been sent to the Senate for consideration. This bill addresses market structure issues and outlines a method for determining whether a digital asset should be classified as a security or a commodity, primarily based on its decentralization. It also assigns regulatory oversight to both the Securities and Exchange Commission (SEC) and the Commodity Futures Trading Commission (CFTC).
These legislative actions provide unprecedented regulatory clarity for the crypto market, directly addressing long-standing industry concerns. The reduction in regulatory uncertainty is a significant factor that could attract increased institutional interest and boost competition within the stablecoin market. While Bitcoin saw a slight dip, companies like Trump Media & Technology Group and Strategy (MSTR) rallied, driven by their Bitcoin holdings and strategic plans. The explicit classification of stablecoins as
not securities is critical, as it de-risks issuance for many entities. The bipartisan support for the CLARITY Act suggests a more stable regulatory path forward, which could reduce political risk for the sector.
Separately, the One Big Beautiful Bill Act (OBBBA), a comprehensive tax and spending package, was signed by President Trump earlier. This legislation includes a permanent extension of tax rates set in the Tax Cuts and Jobs Act of 2017, along with spending cuts for Medicaid and increases for defense and border security. It also extended the nation’s debt ceiling by $5 trillion, preventing a potential government default.
Presidential Influence on Economic Policy
President Trump’s direct influence on economic policy remains a significant factor shaping market sentiment. He has pivoted to implementing long-discussed tariff initiatives, with significant new tariffs slated to take effect on August 1, 2025. This move reopens questions about their potential economic impacts.
Furthermore, President Trump has reiterated his call for lower interest rates, expressing confidence that Fed Chair Jerome Powell may soon act. However, the Federal Reserve has remained firm in its cautious stance, citing concerns about potential inflation threats from the administration’s possible tariff increases, indicating that pressure on the Fed to cut rates is “likely to fall on deaf ears until at least September”. There have also been discussions, from administration sources, about the prospect of Trump removing Powell before his term ends in May 2026, though Trump himself stated on July 16 that it is “doubtful.” Treasury Secretary Scott Bessent suggested Powell should step down as chairman when his term concludes next summer.
This executive dominance in policy formulation, particularly concerning tariffs and the Federal Reserve, creates a less predictable environment compared to traditional Congressional legislative processes. The August 1st tariff deadline and the ongoing pressure on Fed Chair Powell are direct consequences of the President’s policy agenda. The market’s “wait-and-see mode” regarding tariffs illustrates how firms are navigating potential cost increases amidst this uncertainty. This environment necessitates a heightened focus on political analysis for investors, as policy shifts can occur rapidly and impact specific sectors or the broader economy.
III. Standout Sectors
The week ending July 26, 2025, saw a mixed performance across S&P sectors, indicating a nuanced market dynamic beneath the headline index gains.
Top-Performing Sectors
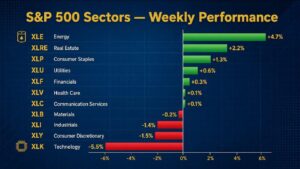
Nine of the 11 major S&P sectors advanced during the week.1 Healthcare emerged as the strongest performer, registering a gain of 3.27%. Industrials followed closely, rising by 2.46%. The Materials sector also experienced significant gains, climbing 1.17%.
The strength observed in Industrials and Materials is likely linked to the prevailing optimism surrounding potential global trade deals and a broader confidence in economic resilience and global trade momentum. These sectors are typically sensitive to international trade flows and overall economic activity, making them direct beneficiaries of positive trade news. Healthcare’s strong performance could be attributed to defensive positioning in a market with mixed economic signals, or specific positive corporate news within the sector, such as Centene’s initial forecast for improved profitability.
Underperforming Sectors
In contrast to the leading sectors, Consumer Defensives were the weakest performers, increasing by only 0.33%. The Technology sector also lagged, with a modest gain of 0.6%. This underperformance in Technology is particularly notable, given that analysts had anticipated S&P 500 earnings to rise 7.7% year-over-year in the second quarter, with gains primarily led by the tech sector.
The underperformance of Technology, despite strong earnings expectations, suggests that investors may be scrutinizing valuations, particularly for growth stocks that are trading at a significant premium. Concerns about rising spending by tech giants, especially in the highly competitive AI space, or intensifying competition from AI-powered search engines, could be contributing factors. For instance, Alphabet’s stock had only a “mild reaction” to its strong earnings, with some investors worried about rising expenditures and competition. This indicates that even robust tech fundamentals are being evaluated through a lens of future profitability and capital efficiency.
Table 2: Top Performing S&P Sectors (Week Ending July 26, 2025)
| Sector Name | Weekly Price Return (%) | Key Drivers/Commentary |
|---|---|---|
| Healthcare | +3.27% | Potential defensive positioning; specific company news (e.g., Centene’s improved profitability forecast) 1 |
| Industrials | +2.46% | Broader confidence in economic resilience and global trade momentum; trade deal optimism 1 |
| Materials | +1.17% | Broader confidence in economic resilience and global trade momentum; trade deal optimism 1 |
| Consumer Defensives | +0.33% | Lagging performance 3 |
| Technology | +0.6% | Underperformance despite strong earnings expectations; concerns over valuation, rising AI spending, and competition 3 |
Table 2 provides a granular view of market dynamics, illustrating which parts of the economy are thriving or struggling. It helps to pinpoint areas of strength and weakness, offering insights for potential investment allocation decisions. The table visually reinforces the narrative about how economic and geopolitical drivers translate into varied sectoral performance.
IV. Standout Stocks
The week ending July 26, 2025, featured significant movements in individual stocks, driven by a combination of corporate earnings, industry-specific developments, and broader market trends, including a notable resurgence in speculative trading.
Key Gainers and Their Catalysts
Several companies posted impressive gains, propelled by strong financial results or favorable news. Deckers Outdoor (DECK) surged by 11% 1 to 12% 8 after reporting better-than-expected quarterly results, primarily driven by robust international demand for its UGG boots and Hoka sneakers.
Newmont (NEM), the world’s largest gold mining company, jumped 6.9% 2 to 2.9% 26 after exceeding quarterly sales and profit estimates. This performance was bolstered by higher gold prices, which hit their highest level in over a month at $3,415 per ounce. The company also announced a $3 billion share buyback program.
VeriSign (VRSN), a provider of internet infrastructure services, climbed 6.7% to close above $300 for the first time, following an increase in its share repurchase program and raised full-year forecasts, despite missing Q2 revenue expectations.
Verizon (VZ) shares jumped 4% on Monday, leading the S&P 500 gainers, after reporting strong Q2 results that surpassed sales and profit estimates, leading to an uplift in its full-year profit outlook. This was primarily driven by better-than-expected gains in broadband internet subscribers and an increase in wireless retail core prepaid customers.
Block (XYZ) surged over 7% on Monday following the announcement that the digital payments provider would replace Hess in the S&P 500. Analysts anticipate a “re-acceleration” in its Cash App segment.
Hershey (HSY) gained 3.2% after stronger-than-expected June retail sales data, which indicated sustained consumer spending despite ongoing tariff concerns.
Cleveland-Cliffs (CLF), a steelmaker, soared 12% as it reported narrowing losses, benefiting from cost-cutting measures, new tariffs, and the Trump administration’s push for increased domestic manufacturing.
A significant trend observed during the week was the resurgence of “meme stock” trading, with companies like Kohl’s (KSS), Opendoor (OPEN), 1-800-FLOWERS (FLWS), GoPro (GPRO), and Krispy Kreme (DNUT) experiencing rapid price surges. This activity reflected a “big appetite for risk” among investors, coinciding with Goldman Sachs’ “Speculative Trading Indicator” reaching its highest level outside of the 1998-2001 dot-com bubble and the 2020-2021 pandemic rallies. Opendoor, in particular, soared approximately 50% this week, nearly tripling in value in the preceding week. This indicates a significant increase in risk appetite among retail investors, potentially fueled by liquidity and social media-driven enthusiasm, where fundamental valuations may be secondary to momentum and community-driven trading. This phenomenon suggests a return of speculative fervor, which could be a precursor to increased market volatility or a sign that some areas are becoming overheated.
In the crypto-related space, Trump Media & Technology Group (DJT) was up 5% after announcing it had amassed roughly $2 billion in Bitcoin and Bitcoin-related securities, representing about two-thirds of its liquid assets, and plans to launch crypto exchange-traded funds later in the year.
Strategy (MSTR) also saw a 2.5% increase, having purchased 6,220 Bitcoin last week, bringing its total holdings to 607,770 Bitcoin.
Significant Losers and Their Factors
Conversely, some stocks experienced notable declines. Intel (INTC) tumbled 8.5% 1 to 7% 8 after forecasting steeper quarterly losses and announcing job cuts, which hurt the broader chip sector.
Charter Communications (CHTR) plunged 18% following a sharper-than-expected loss in broadband subscribers, attributed to intensifying competition from 5G bundles.1
Centene (CNC) fell 15% 8 after missing analyst earnings estimates and cutting its 2025 outlook, despite an earlier forecast for improved profitability by 2026.
Natural gas companies, including EQT (EQT), Expand Energy (EXE), Coterra Energy (CTRA), and Targa Resources (TRGP), saw their stocks decline. EQT tumbled 9.5% and Expand Energy was down 8.5%, as natural gas futures prices dropped around 7% due to elevated production levels and forecasts for cooler summer temperatures, which reduced demand.
Sarepta Therapeutics (SRPT) continued its slide after refusing an FDA request to halt distribution of its Elevidys treatment for muscular dystrophy, following a third patient death in a similar gene therapy study.
Specific Corporate Earnings Impacts
Alphabet (GOOGL) reported strong Q2 2025 financial results, surpassing Wall Street expectations with $96.4 billion in revenue (up 14% year-over-year) and earnings per share of $2.31 (up 22%). Google Cloud revenue jumped 32%, and Google Services (including Search and YouTube ads) increased by 12%. AI tools, such as AI Overviews (reaching over 2 billion monthly users) and the Gemini chatbot (surpassing 450 million monthly active users), saw rapid adoption. Alphabet also increased its 2025 capital expenditure forecast to approximately $85 billion, a $10 billion jump, driven by rising demand for cloud infrastructure and AI services. Despite these strong results, the stock experienced only a mild reaction, with some investors expressing concern about rising spending and increasing competition from AI-powered search engines, which raised questions about future returns and operational efficiency.
This situation highlights an “AI paradox” in tech earnings. While AI is a massive growth driver, the market is becoming increasingly discerning about its profitability and the associated costs. The substantial investment required for AI infrastructure, as evidenced by Alphabet’s increased capital expenditures, represents a significant drag on short-term profitability, or at least raises questions about the return on investment. This, combined with fierce competition among tech giants, is creating a highly competitive environment where only the most efficient and innovative are likely to thrive. The market’s punishment of companies that miss earnings or show signs of inefficiency, even in a high-growth area like AI, underscores this shift in investor focus.
Intel (INTC), another major chip company, missed EPS estimates and predicted below-consensus Q3 earnings growth, resulting in a significant stock drop. This reinforces the capital-intensive and competitive nature of the semiconductor sector, where even minor missteps or pessimistic forecasts can result in substantial investor rebukes.
Paramount Global slipped 1.6% after regulators cleared its US$8.4 billion merger with Skydance Media.
Stellantis (STLA) climbed nearly 1% despite reporting a net loss for the first half of the year, attributed to tariffs, restructuring costs, and a sales slump, with $300 million in net expenses stemming from the “early effects of US tariffs”.
Domino’s (DPZ) dropped nearly 1% after its earnings fell slightly short of estimates, even though same-store sales growth was better than expected.
Table 3: Key Standout Stocks: Gainers and Losers (Week Ending July 26, 2025)
| Company Name | Ticker | Weekly Change (%) | Primary Catalyst/Reason for Movement |
|---|---|---|---|
| Deckers Outdoor | DECK | +11% to +12% | Better-than-expected quarterly results; strong international demand 1 |
| Newmont | NEM | +6.9% to +2.9% | Better-than-expected sales/profits; higher gold prices; $3B buyback 2 |
| VeriSign | VRSN | +6.7% | Boosted share repurchase; lifted full-year forecasts; strong demand 2 |
| Verizon Communications | VZ | +4% | Strong Q2 results; lifted outlook; broadband subscriber gains 26 |
| Block | XYZ | +7% | S&P 500 inclusion; expected Cash App re-acceleration 26 |
| Hershey | HSY | +3.2% | Stronger-than-expected June retail sales data 26 |
| Cleveland-Cliffs | CLF | +12% | Narrowing losses; cost cutting; new tariffs; domestic manufacturing push 26 |
| Kohl’s | KSS | +33.51% | Meme stock activity; heightened risk appetite 2 |
| Opendoor Technologies | OPEN | ~+50% | Meme stock activity; analyst prediction of “100-bagger” 2 |
| Trump Media & Tech Group | DJT | +5% | Amassed $2B in Bitcoin; plans for crypto ETFs 26 |
| Strategy | MSTR | +2.5% | Purchased 6,220 Bitcoin; increased total holdings 26 |
| Intel | INTC | -8.5% to -7% | Forecasted steeper quarterly losses; announced job cuts 1 |
| Charter Communications | CHTR | -18% | Sharper-than-expected loss in broadband subscribers; 5G competition 1 |
| Centene | CNC | -15% | Missed earnings estimates; cut 2025 outlook 8 |
| Natural Gas Companies | EQT, EXE, CTRA, TRGP | -8.5% to -9.5% | Drop in natural gas futures prices; elevated production; cooler forecasts 26 |
| Sarepta Therapeutics | SRPT | Continued slide | Refused FDA request to stop distribution; patient deaths in study 26 |
Table 3 illustrates the micro-level dynamics of the market, providing concrete examples of how both macro-level factors (economic, geopolitical, political) and micro-level factors (corporate earnings, competition) translate into individual stock performance. It highlights the diverse catalysts at play across the market and offers actionable information for investors seeking to understand specific company movements.
V. Outlook and Implications for Investors
Forward-Looking Market Sentiment
Market sentiment remains cautiously optimistic, primarily supported by hopes for a U.S.-EU trade deal and a generally robust corporate earnings season. However, this optimism is tempered by light trading volume and mixed signals from economic indicators.1 The market is currently trading at a slight premium to its fair value, with growth stocks notably at an 18% premium. This suggests a limited “margin of safety” for investors should tariff negotiations falter or if future earnings guidance proves disappointing.15 Conversely, small-cap stocks are identified as attractively valued, trading at a 12% discount, though it may take some time for them to gain significant traction.
Anticipated Catalysts for the Coming Weeks
Several key events are expected to shape market direction in the immediate future:
- Federal Reserve Meeting (July 31): All attention is focused on the Federal Reserve’s policy meeting, where rates are widely expected to remain unchanged. However, traders are increasingly pricing in a 60% chance of a rate cut by September 1
- Continuation of Earnings Season: The earnings season will continue with reports from market heavyweights, including Microsoft, Apple, Amazon, and Meta Platforms. Analysts are projecting a 7.7% year-over-year rise in S&P 500 earnings for the second quarter, primarily driven by the technology sector.
- August 1 Trade Deadline: The White House’s deadline for finalizing trade agreements with various nations, including the EU, presents a critical juncture. Failure to reach a deal could trigger the imposition of a 30% tariff on EU imports.
- July Nonfarm Payrolls Report (August 1): This crucial economic data release will provide further insights into the health of the U.S. labor market and will undoubtedly influence the Federal Reserve’s future policy considerations.
- CLARITY Act Senate Approval: The Digital Asset Market Clarity Act, which aims to provide clearer regulatory frameworks for digital assets, is awaiting Senate approval. Its passage could further bolster investor confidence in the crypto space.
Strategic Considerations for Investors
The current market environment necessitates a nuanced approach to investment strategy.
Monetary Policy and Market Expectations: The market is currently pricing in a high probability of Federal Reserve rate cuts later in the year, which is typically supportive of equity valuations. However, the underlying economic data presents a complex picture. Inflation ticked up to 2.7% in June 9, and the Leading Economic Index suggests a potential economic deceleration.4 If inflation persists or accelerates, possibly due to tariffs, the Federal Reserve might be compelled to delay rate cuts, which could lead to market disappointment. Conversely, a more pronounced economic slowdown could intensify the pressure for rate reductions. A balance of inflation, employment, and growth data will drive the Federal Reserve’s actual decisions. A mismatch between market expectations and the Federal Reserve’s actions could trigger significant volatility, emphasizing the need for investors to avoid over-reliance on a specific rate cut timeline.
Trade Policy and Market Volatility: While the market has appeared resilient in the face of tariff threats, the August 1st deadline and the potential for retaliatory measures from the EU introduce significant near-term risk. Tariffs could directly impact corporate earnings by increasing input costs and potentially dampen consumer spending due to higher prices.5 Investors should closely monitor developments in trade negotiations, as sudden policy shifts could lead to market dislocations. This environment requires investors to integrate political risk analysis more deeply into their investment frameworks, as companies and sectors most exposed to these policy shifts will likely experience heightened volatility.
Sector Rotation and Valuation: Given the current overvaluation in growth stocks and the recent underperformance of the technology sector, investors might consider rebalancing their portfolios. A shift towards value stocks and sectors demonstrating resilience, such as Healthcare and Industrials, could be a prudent strategy.3 The strength in Industrials and Materials, linked to trade optimism, suggests potential opportunities in cyclical sectors. At the same time, the mild reaction to strong tech earnings indicates a more discerning approach to high-growth, high-valuation names.
AI Investment Nuance: While artificial intelligence remains a powerful long-term investment theme, the market is increasingly scrutinizing the profitability and capital expenditure associated with it. The “AI paradox,” where strong revenue growth is met with mild stock reactions due to high investment costs, suggests that selective investment in AI-driven companies will be crucial. Investors should focus on companies with clear monetization strategies and efficient operations, rather than simply chasing growth at any cost.22 This could lead to increased volatility and a “winner-take-all” dynamic within the AI segment.
Crypto Regulatory Environment: The recent passage of the GENIUS Act and the progress of the CLARITY Act signal a maturing regulatory landscape for digital assets in the U.S. This increased clarity could attract more institutional capital and foster innovation within the crypto space.6 However, investors should note that the tax treatment of cryptocurrency as property remains unchanged, and the market will need to absorb the implications of these new regulatory frameworks fully.
Conclusions
The U.S. stock market’s performance in the week ending July 26, 2025, was characterized by robust gains in major indices, reaching new record highs, driven primarily by optimism surrounding a potential U.S.-EU trade agreement and upbeat corporate earnings. This strong headline performance, however, was accompanied by light trading volume, suggesting a cautious underlying sentiment rather than broad-based conviction.
Economic indicators presented a mixed picture: while the Coincident Economic Index showed current stability, the Leading Economic Index continued its decline, signaling potential future economic deceleration, partly due to anticipated impacts of tariffs. Inflation ticked higher, complicating the Federal Reserve’s monetary policy decisions, as the market’s expectation for rate cuts contrasts with persistent price pressures.
Geopolitically, hopes for a trade deal provided a short-term boost; however, the broader landscape indicates a persistent shift towards protectionism and geoeconomic fragmentation, particularly intensified by the U.S.-China strategic competition centered on AI. This underscores AI’s dual role as both a powerful economic driver and a significant source of geopolitical tension.
Domestically, U.S. political developments, notably the signing of the GENIUS Act and the progress of the CLARITY Act, are ushering in a new era of regulatory clarity for the crypto market, potentially attracting institutional interest. Simultaneously, President Trump’s direct influence on tariff and monetary policy introduces a degree of executive-driven volatility that necessitates close monitoring by market participants.
The market’s resilience in the face of these complex and often contradictory signals suggests an adaptation to a “policy-driven” environment. However, investors face a delicate balance between leveraging opportunities in growth areas, such as AI, and navigating risks stemming from potential economic slowdowns, persistent inflation, and unpredictable trade policy shifts. Strategic positioning will increasingly involve a deep understanding of both traditional financial fundamentals and the evolving geopolitical and political landscape.