
Summary
- Microsoft Cloud revenue crossed $51.5 billion quarterly, up 26% year-over-year ( Microsoft Q2 FY26 Press Release)
- Azure revenue grew 39%, with AI services driving acceleration from 31% in Q2 FY25 ( Microsoft Investor Relations)
- Commercial remaining performance obligation (RPO) surged to $625 billion, up 110% ( Fortune)
- Capital expenditures hit $37.5 billion in a single quarter, with two-thirds on GPUs and CPUs ( CNBC)
- Microsoft 365 Copilot reached 15 million paid seats; GitHub Copilot grew to 4.7 million subscribers ( The Globe and Mail)
About the Author
David L. Berkowitz , Chief Investment Officer and Financial Advisor
Nearly 40 years of experience — from trading and research at a $250 million hedge fund in the early 1990s, to two decades as a portfolio manager, to teaching thousands of executives and employees how to create shareholder value through EVA and value-based management. Now helping individuals and families become shareholders through disciplined investing, concentrated portfolios, and direct stock ownership.
What Does Microsoft’s AI Scale Look Like Today?
Satya Nadella made a striking claim during the January 2026 earnings call: Microsoft has built an AI business larger than some of its biggest franchises that took decades to build. That statement captures the velocity of what’s happening inside Redmond. In Q2 FY25, Microsoft’s AI business surpassed a $13 billion annual run rate, up 175% year over year ( Microsoft Q2 FY25 Press Release). One year later, the scale is unmatched in the company’s history.
Microsoft Cloud revenue hit $51.5 billion for the quarter, crossing the $50 billion mark for the first time ( Microsoft Q2 FY26 Press Release). That’s 26% growth. Azure revenue accelerated to 39%, up from 31% in the same quarter a year earlier. The math tells the story: Microsoft added roughly $11 billion in quarterly cloud revenue in 12 months.
How Has Microsoft’s Strategy Evolved From Infrastructure to Agents?
The company’s narrative has shifted significantly. In early 2025, management described a technology stack: Azure for infrastructure, Microsoft Fabric for the data layer, Azure AI Foundry for tools, and Microsoft 365 Copilot for the user interface. It was a builder’s framework.
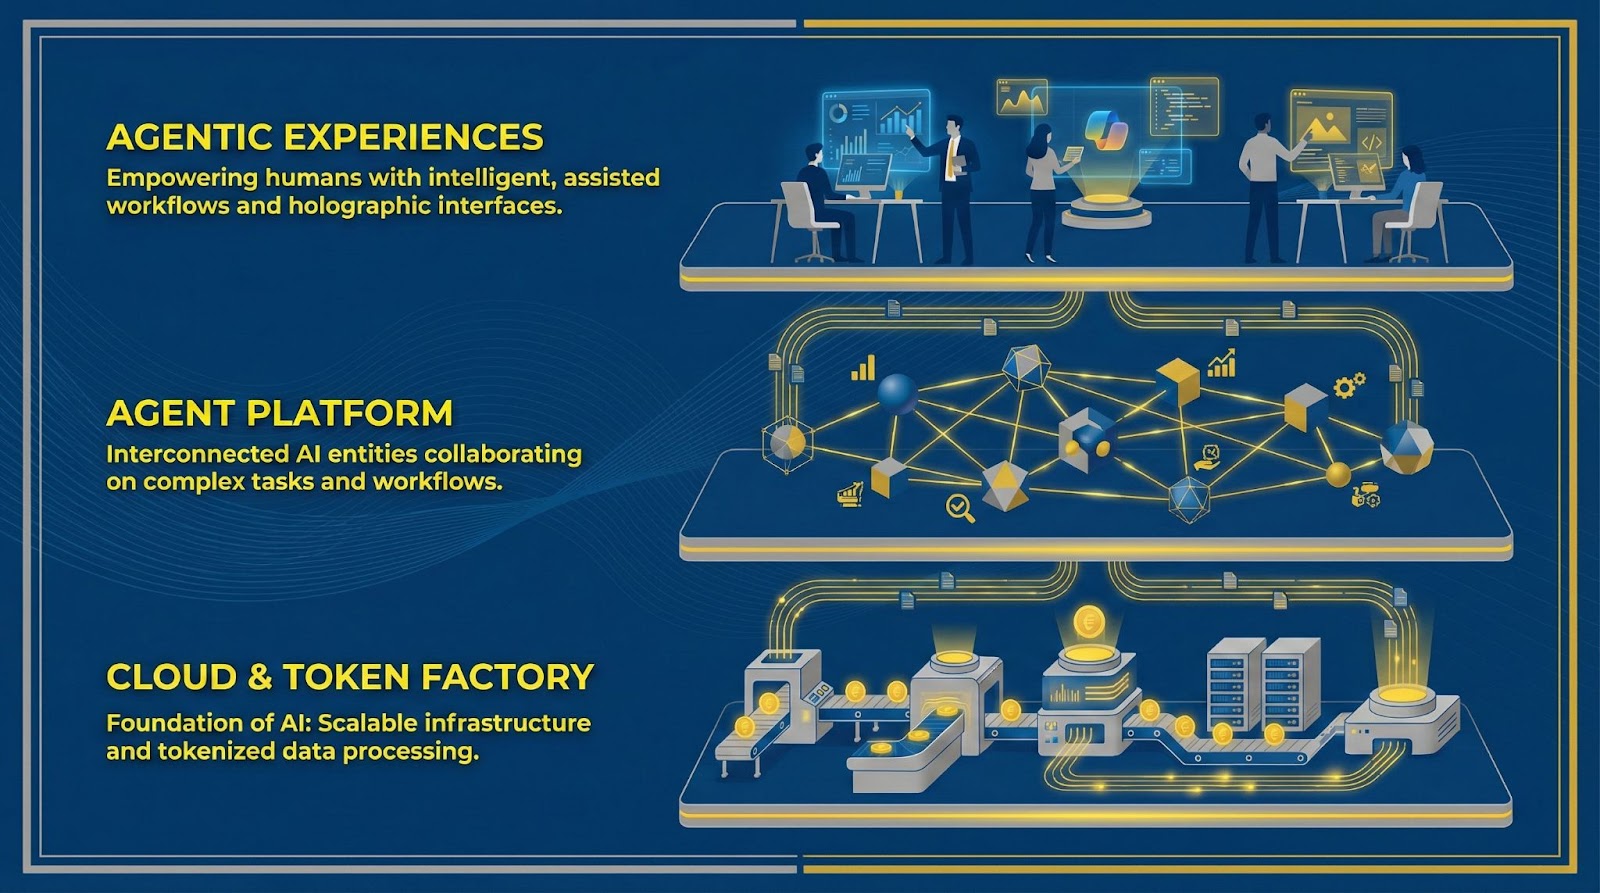
By January 2026, Nadella reframed the entire strategy around three layers: a “cloud and token factory” focused on tokens per watt per dollar; an “agent platform” where agents replace traditional apps; and “high-value agentic experiences” that perform tasks through what he called “macro delegation and micro steering” ( Yahoo Finance Earnings Call Highlights). This isn’t wordsmithing. The shift reflects Microsoft’s belief that the software industry itself is being rewritten—with agents as the new applications.

What Do the Capital Expenditures Reveal?
Microsoft spent $37.5 billion on capital expenditures in Q2 FY26 alone—up 66% from $22.6 billion in the same quarter a year earlier ( Fortune). The first half of FY26 saw $72.4 billion in total capex. Roughly two-thirds went to short-lived assets: GPUs and CPUs. The company added nearly 1 gigawatt of data center capacity in a single quarter.
CFO Amy Hood explained the rationale: this infrastructure is “fungible.” The same GPU fleet serves Azure customers, powers Microsoft 365 Copilot and GitHub Copilot, and supports internal R&D. Hood disclosed that incoming capacity is allocated first to high-growth first-party applications, then to R&D, and then to Azure customers. If all H1 FY26 GPU capacity had gone exclusively to Azure, growth would have exceeded 40% ( Microsoft Q1 FY26 Earnings Call).
The key risk mitigator: most of this GPU capacity is already contracted for the hardware’s full 6-year useful life. Long-term commitments from partners like OpenAI reduce stranded-asset risk.
Financial Performance: Q2 FY25 vs. Q2 FY26
| Metric | Q2 FY2025 | Q2 FY2026 |
|---|---|---|
| Total Revenue | $69.6B (+12%) | $81.3B (+17%) |
| Microsoft Cloud Revenue | $40.9B (+21%) | $51.5B (+26%) |
| Azure Growth | 31% | 39% |
| AI Business Run Rate | >$13B (+175%) | Larger than decades-old franchises |
| Commercial RPO | $298B (+36%) | $625B (+110%) |
| Capital Expenditures | $22.6B | $37.5B |
| EPS (Non-GAAP) | $3.23 | $4.14 (+24%) |
How Deep Is the OpenAI Relationship?
The numbers are stark. Microsoft’s commercial remaining performance obligation—essentially contracted future revenue—hit $625 billion, up 110% year-over-year. OpenAI accounts for approximately 45% of that total, or roughly $280 billion ( Tech Times). This includes a $250 billion cloud commitment announced in October 2025 as part of OpenAI’s restructuring.
Hood addressed concentration risk directly: the remaining 55%—roughly $350 billion—comes from a diversified customer base across industries and geographies, growing 28% year-over-year. That non-OpenAI RPO exceeds most competitors’ entire backlog ( The Register).

What Do the Copilot Adoption Numbers Show?
Microsoft 365 Copilot reached 15 million paid seats—up over 160% year-over-year. Daily active users increased 10x compared to the prior year. The number of customers with more than 35,000 seats tripled. Publicis bought 95,000 seats in a single purchase ( CNBC). With 450 million paid Microsoft 365 commercial seats overall, Copilot penetration sits at just 3.3%. The runway remains long.
GitHub Copilot grew to 4.7 million paid subscribers, up 75% year-over-year. Siemens deployed the platform to over 30,000 developers. Nadella noted that GitHub Copilot has become larger than all of GitHub was when Microsoft acquired the platform for $7.5 billion in 2018 ( Tribune India).
What’s Happening With Microsoft Fabric?
Microsoft Fabric’s annual revenue run rate crossed $2 billion with over 31,000 customers—up 60% year-over-year. Nadella called it the fastest-growing analytics product in Microsoft’s history when it launched. The growth trajectory validates that claim ( Yahoo Finance). For AI workloads to function at enterprise scale, they require unified data platforms. Fabric serves as the context layer for agentic applications.
Why Does Microsoft’s Custom Silicon Matter?
Microsoft brought its Maia 200 AI accelerator online, delivering over 30% improved total cost of ownership compared to the latest third-party hardware. The Cobalt 200 CPU showed over 50% higher performance than its predecessor. The goal: maintain fleet flexibility with access to NVIDIA, AMD, and internal silicon—optimizing for tokens per watt per dollar rather than locking into a single supplier.
This matters for margin trajectory. AI infrastructure scaling has compressed Microsoft Cloud gross margin to 67% from 70% a year earlier. Custom silicon and software optimizations compound over time. Nadella cited historical patterns: 2x price-performance gains per hardware generation and 10x gains per model generation from software improvements.
What Are the Capacity Constraints?
Demand exceeds supply. Microsoft expects to remain capacity-constrained through at least the end of FY26 (June 2026). Hood noted the company must balance growing Azure demand against first-party AI usage across M365 Copilot and GitHub Copilot, R&D allocations, and end-of-life server replacements ( CIO Dive).
This constraint creates an unusual dynamic: Microsoft is throttling its own Azure revenue growth to fuel first-party product adoption. It’s a deliberate trade-off between near-term cloud revenue and longer-term platform lock-in through Copilot experiences.
What About Windows 11?
Windows 11 reached 1 billion users—a 45% year-over-year increase ( The Register). The milestone came faster than Windows 10 achieved the same threshold, driven partly by the October 2025 end-of-support deadline for Windows 10. That said, roughly 1 billion PCs remain on Windows 10, split between 500 million capable of upgrading and 500 million with incompatible hardware.
Investment Implications
The earnings report reveals a company in transition. Microsoft is spending aggressively—$72.4 billion in capex over six months—while navigating supply constraints that prevent it from fully monetizing existing demand. The OpenAI concentration (45% of RPO) creates counterparty risk, though the remaining customer base provides substantial diversification.
The Copilot numbers suggest early innings. With 15 million seats against 450 million commercial M365 users, penetration remains below 4%. The question isn’t whether enterprises will adopt AI assistants—the steep growth rates answer that. The question is how quickly Microsoft can ship GPU capacity to meet demand.
For long-term shareholders, the fungible infrastructure model deserves attention. Every dollar of capex serves multiple revenue streams: Azure consumption, M365 Copilot seats, GitHub subscriptions, and R&D capabilities that produce the next generation of products. That’s not true for competitors building single-purpose infrastructure.
The margin compression is real but predictable. Gross margins dropped 300 basis points as AI infrastructure scaled. Management expects operating margins to improve slightly for the full year, driven by efficiency gains. The bet: today’s infrastructure investment compounds into tomorrow’s high-margin software revenue.
Endnotes
-
Microsoft Q2 FY25 Press Release – Official Q2 FY2025 earnings announcement with AI business run rate and Azure growth data.https://www.microsoft.com/en-us/investor/earnings/fy-2025-q2/press-release-webcast
-
Microsoft Q2 FY26 Press Release – Official Q2 FY2026 earnings announcement with cloud revenue milestone and commercial RPO figures.https://www.microsoft.com/en-us/investor/earnings/fy-2026-q2/press-release-webcast
-
Microsoft Q2 FY26 Performance – Detailed segment performance breakdown from Microsoft Investor Relations.https://www.microsoft.com/en-us/Investor/earnings/FY-2026-Q2/performance
-
Fortune – Analysis of Microsoft demand backlog and OpenAI relationship with capital expenditure details.https://fortune.com/2026/01/28/microsoft-stock-drops-azure-growth-slows-capex-spending-q2/
-
CNBC – Microsoft Q2 FY26 earnings report coverage with Copilot seat data and capacity constraint analysis.https://www.cnbc.com/2026/01/28/microsoft-msft-q2-earnings-report-2026.html
-
Yahoo Finance Earnings Call Highlights – Summary of Microsoft Q2 FY26 earnings call with CEO and CFO commentary on agent platform strategy.https://finance.yahoo.com/news/microsoft-q2-earnings-call-highlights-010010532.html
-
The Globe and Mail – Full earnings call transcript with detailed Copilot subscriber counts and customer deployment figures.https://www.theglobeandmail.com/investing/markets/stocks/MSFT/pressreleases/37285635/microsoft-msft-q2-2026-earnings-call-transcript/
-
Tech Times – Analysis of Microsoft’s OpenAI dependency and Azure capacity constraints.https://www.techtimes.com/articles/314357/20260129/microsofts-azure-capacity-crunch-highlights-growing-dependence-openai.htm
-
The Register – Coverage of Windows 11 billion-user milestone and investor concerns about OpenAI concentration.https://www.theregister.com/2026/01/29/microsoft_earnings_q2_2026/
-
Tribune India – CEO Satya Nadella commentary on AI business scale and GitHub Copilot growth.https://www.tribuneindia.com/news/ai-business/weve-built-an-ai-business-larger-than-some-of-our-biggest-franchises-that-took-decades-says-microsoft-ceo-amid-quarterly-revenue-report-of-usd-81-3-billion
-
Microsoft Q1 FY26 Earnings Call – Forward guidance and capacity allocation strategy details from October 2025 earnings call.https://www.microsoft.com/en-us/investor/events/fy-2026/earnings-fy-2026-q1
-
CIO Dive – Microsoft AI cloud growth analysis with capacity constraint reporting.https://www.ciodive.com/news/microsoft-AI-cloud-growth-earnings-Q1/804338/
-
Windows Central – Windows 11 adoption milestone coverage and user statistics.https://www.windowscentral.com/microsoft/windows-11/windows-11-surpasses-1-billion-users-after-4-years-faster-than-windows-10-ever-did


