
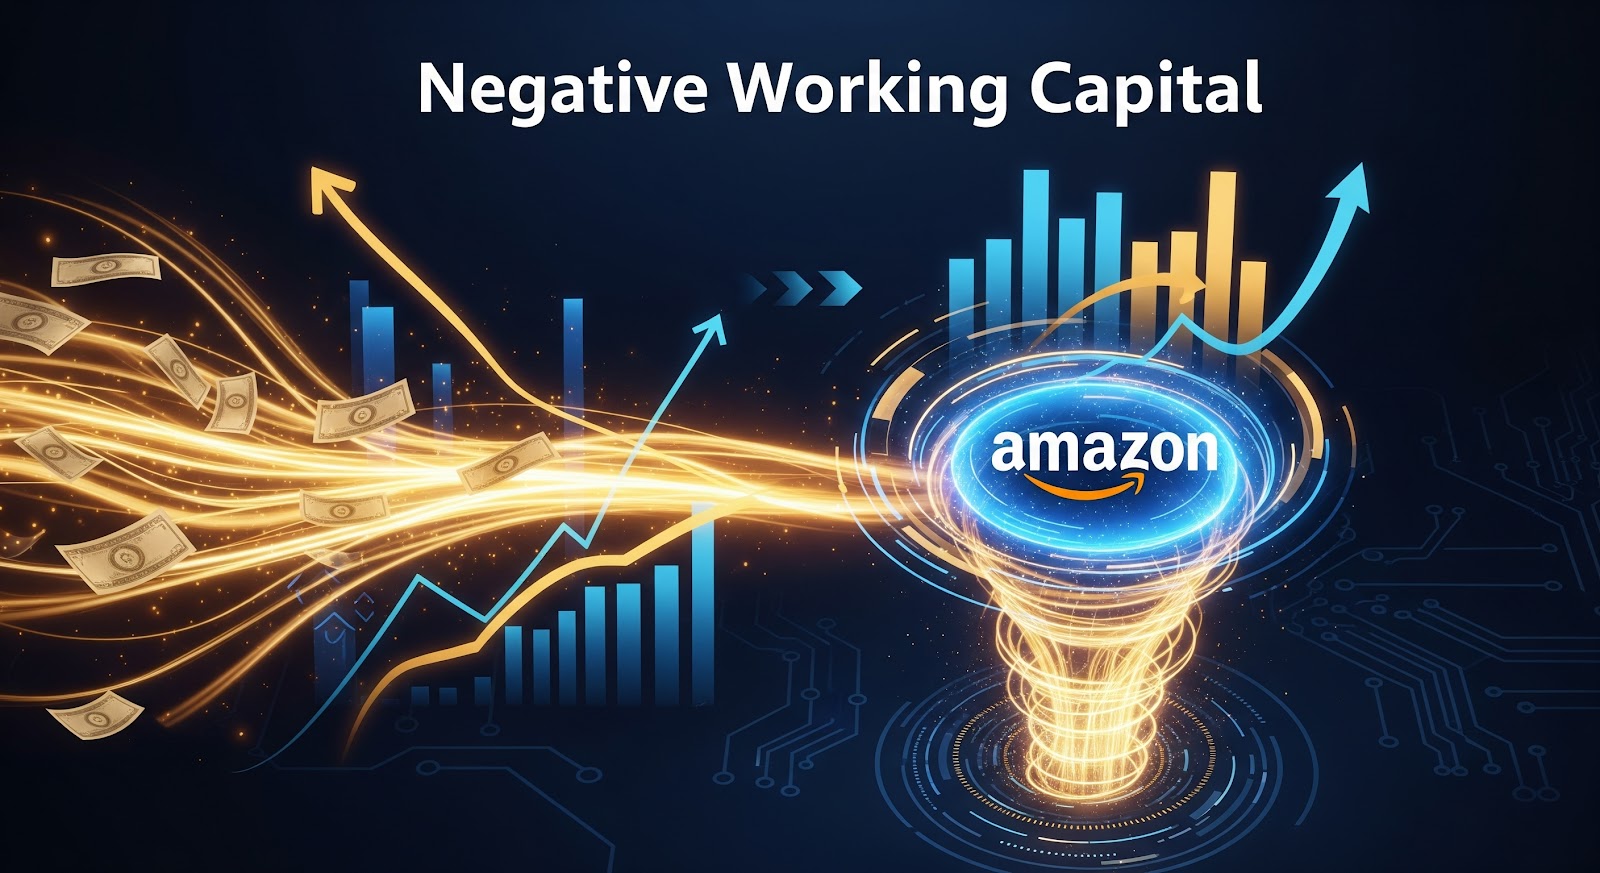
Amazon’s primary financial advantage is its negative net working capital , which reached -$90 billion in 2024 . This functions as a massive, interest-free loan from its suppliers and customers, providing approximately $8 billion in annual financing value at current capital costs.
The company achieves this by collecting cash from customers almost immediately (via credit card payments and prepayments like AWS contracts and Prime memberships). Simultaneously, it pays its suppliers on extended terms, averaging a remarkably stable 100-110 days for over a decade.
This working capital “float” funds Amazon’s explosive growth. It allows the company to deploy $380 billion in infrastructure while achieving a 52% return on gross operating assets —roughly six times its 9% weighted average cost of capital.
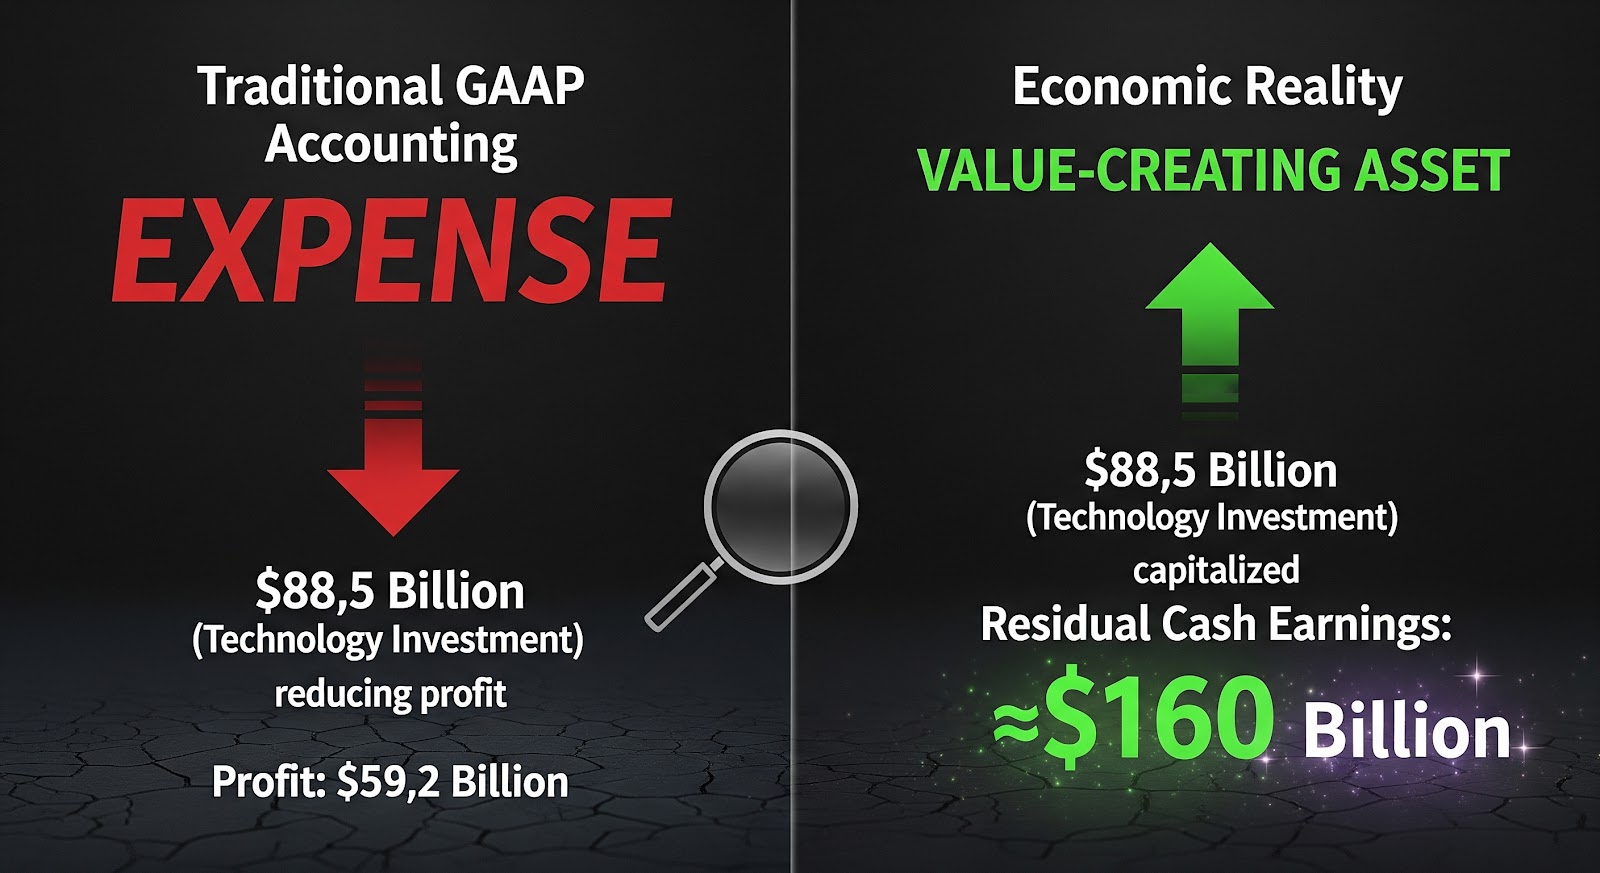
Furthermore, traditional accounting metrics significantly understate Amazon’s true profitability. By expensing $88.5 billion in technology investments as a period cost, GAAP net income ($59.2B in 2024) obscures its true economic profit. My analysis shows its Residual Cash Earnings (RCE) are approximately $160 billion , nearly triple the reported figure.
What is Negative Net Working Capital and Why is it Amazon’s $90B Secret?
In most businesses, negative net working capital is a red flag, suggesting a company cannot meet its short-term obligations. Based on my analysis of Amazon’s financials, the opposite is true: it is a $90 billion strategic advantage.
This advantage is built by structuring cash flows to receive money long before it is paid out. Amazon collects cash instantly from customers but uses its immense scale and negotiating power to pay suppliers 60-90 days or more later. This gap creates a permanent, interest-free source of financing that grows as the company scales.
Amazon’s Negative Working Capital Components (2024)
| Component | Amount | Strategic Function |
|---|---|---|
| Accounts Payable & Accrued Expenses | ~$174B | Supplier financing at zero cost. |
| Deferred Revenue | ~$21B | Customer prepayments (e.g., AWS, Prime). |
| Accounts Receivable | ~$61B | Fast cash collection from customers. |
| Net Operating Working Capital | -$90B | Interest-free financing for growth. |
For Amazon, negative working capital is not a sign of financial distress but a sophisticated financial engine. This -$90 billion in operating working capital provides financing that would otherwise cost an estimated $8 billion annually at the company’s 9% cost of capital.
How Does Amazon’s Cash Conversion Cycle Create a Sustainable Moat?
Amazon’s sustainable advantage is locked in its cash conversion cycle—the time it takes to convert inventory and payables into cash.
Based on my analysis of its financial reports, Amazon’s Days Payable Outstanding (DPO) has remained stable at 100-110 days for over a decade. This stability is remarkable, as it held even as revenue scaled from $34 billion in 2010 to $638 billion in 2024.
This creates a structural moat that competitors cannot replicate. They lack the scale and supplier dependency to negotiate 100-day payment terms while simultaneously collecting cash from customers immediately.
The Amazon “Float” Mechanism
- Day 1: A customer buys a product. Amazon collects the cash immediately via credit card.
- Day 1 (Marketplace): A customer buys from a 3rd-party seller. Amazon collects the cash, holds it, and takes a commission.
- Day 1 (AWS): An enterprise customer prepays for an annual cloud computing contract.
- Days 1-90: Amazon holds and deploys this cash (the “float”) to fund operations, build data centers, and expand fulfillment networks.
- Day 100: Amazon pays its supplier for the product sold on Day 1.
Amazon has effectively turned its growth into free capital. Every new dollar of revenue generates more incremental working capital financing, creating a self-funding flywheel .
How Do AWS, Retail, and Marketplace Amplify This Advantage?
Not all of Amazon’s businesses contribute equally to this effect. My evaluation of Amazon’s portfolio shows that its diversification is a key financial strength, with its highest-growth segments providing the most tremendous working capital benefits.
Working Capital Dynamics by Business Unit
| Business Unit | Working Capital Mechanic | Strategic Impact |
|---|---|---|
| Retail | Collects cash instantly from customers. Pays suppliers on 60-90+ day terms. | Creates a substantial cash float. |
| AWS | Collects large annual contracts upfront from enterprise customers. | Creates large deferred revenue balances. Customer prepayments finance infrastructure buildout. |
| Marketplace | Collects customer payment immediately. Pays sellers on a settlement schedule. | Pure working capital benefit. Amazon holds customer cash while taking zero inventory cost or risk . |
The shift in Amazon’s business mix toward AWS and the third-party marketplace (which now accounts for over 60% of units sold) structurally accelerates the negative working capital advantage. These high-margin businesses naturally drive working capital to be more negative, compounding the company’s financial position.
Why Does Traditional Accounting Understate Amazon’s True Profit?
Traditional accounting, or GAAP, fundamentally mischaracterizes Amazon’s business model. GAAP requires companies to expense most research and development costs immediately.
For Amazon, this means its $88.5 billion investment in “Technology and Infrastructure” in 2024 is treated as a period cost, just like rent or utilities.
However, this $88.5B is not a simple expense; it is the capital used to build AWS data centers, develop AI algorithms, and automate fulfillment networks. These are long-term, value-creating assets.
Economic Reality vs. Traditional Accounting (2024)
| Metric | Traditional View (GAAP) | Economic Reality (RCE) |
|---|---|---|
| Technology Investment | $88.5B expensed, reducing profit. | $88.5B capitalized as a value-creating asset. |
| Reported Profit | $59.2B Net Income. | ~$160B Residual Cash Earnings. |
| Valuation (P/E) | Appears expensive. | Reasonable relative to true economic earnings. |
Investors relying solely on GAAP metrics and P/E ratios are misinterpreting Amazon’s value. The RCE framework I use reveals that Amazon’s true 2024 economic profit is nearly triple its reported net income.
What is Residual Cash Earnings (RCE) and Why is it a Better Metric?
To understand Amazon’s true performance, my analysis uses the Residual Cash Earnings (RCE) framework.
RCE measures a company’s true economic profit by taking its after-tax cash operating earnings and subtracting a capital charge for all capital deployed.
This framework makes two critical corrections that GAAP and other metrics like Economic Value Added (EVA) miss:
- Capitalizes Growth Investments: RCE treats investments, such as Amazon’s $88.5B in Technology & Infrastructure, as capital assets, not expenses.
- Uses Gross Assets: RCE uses gross (undepreciated) operating assets to calculate the capital charge. This avoids distorting EVA, which uses net (depreciated) assets. Using net assets artificially boosts returns as assets age, rewarding companies for not investing.
RCE vs. EVA and GAAP
| Metric | Treatment of Tech Investment | Asset Base for Capital Charge | Result |
|---|---|---|---|
| GAAP Net Income | Expensed (reduces profit). | N/A | Understates profit for high-growth tech firms. |
| EVA | Expensed (can be adjusted). | Net (Depreciated) Assets. | Distorts returns; penalizes new investment. |
| RCE | Capitalized (treated as an asset). | Gross (Undepreciated) Assets . | Accurately reflects true economic profit. |
RCE is superior for evaluating technology and other high-growth companies because it correctly identifies intangible investments as value-creating assets and applies a consistent capital charge, revealing true economic performance. By this measure, Amazon generated$884 billion in cumulative RCE from 2010 to 2024, growing at a 30% annual rate.
📈 Your Next Action: How to Analyze Companies Like Amazon
As a financial advisor, my analysis shows that investors must look beyond traditional accounting to identify true value creation. Amazon’s model provides a clear framework for analyzing any business.
When evaluating a company, apply this 3-step process to uncover its true economic performance:
- Adjust for Intangible Investments: Look beyond GAAP net income. Identify significant R&D, technology, or brand-building expenses (like Amazon’s $88.5B in tech). Add these back to operating profit to better understand true cash earnings before growth-focused capital deployment.
- Analyze Working Capital Dynamics: Do not assume negative working capital is a weakness. Calculate the Days Payable Outstanding (DPO) and compare it to Days Sales Outstanding (DSO). If DPO is significantly larger (like Amazon’s 100+ days), the company is using its supply chain as a source of free financing.
- Focus on Returns vs. Cost of Capital: Calculate the company’s return on its gross operating assets (ROGOA). Compare this return to its weighted average cost of capital (WACC). A business that generates a significant and sustainable spread (like Amazon’s 52% ROGOA vs. 9% WACC) is a high-quality enterprise creating substantial shareholder value.